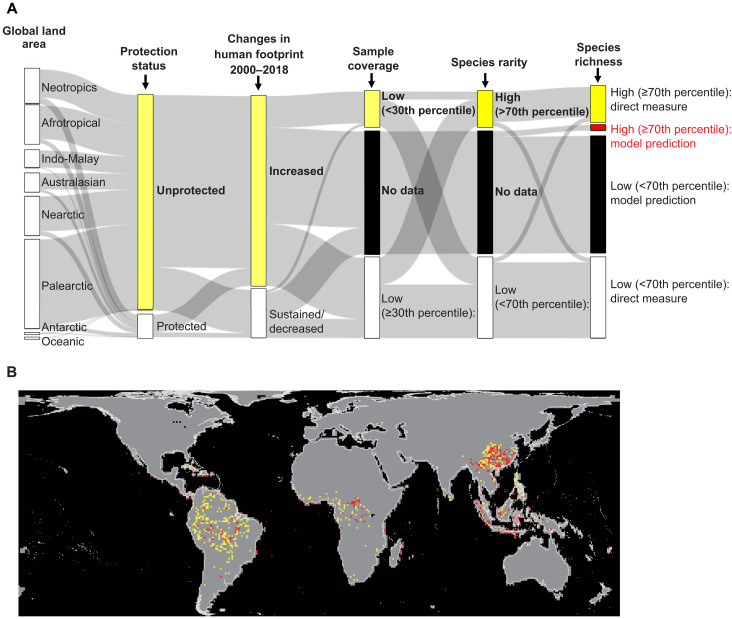
Fig. 6. Spatial priority areas for improving sample completeness of species occurrence records of woody angiosperms.
(A) Composition of the attributes used to define the priority areas. (B) The geographical map. Yellow color represents the priority areas defined as low sample coverage (<30th percentile of sample coverage values among the grid cells), high species rarity (≥70th percentile of species rarity values among the grid cells), high species richness (≥70th percentile of species richness values among the grid cells), unprotected, and increased human footprint from 2000 to 2018. Red color represents the grid cells with similar values except no occurrence data but predicted as potentially high species richness (≥70th percentile of species richness) by the random forest model.

