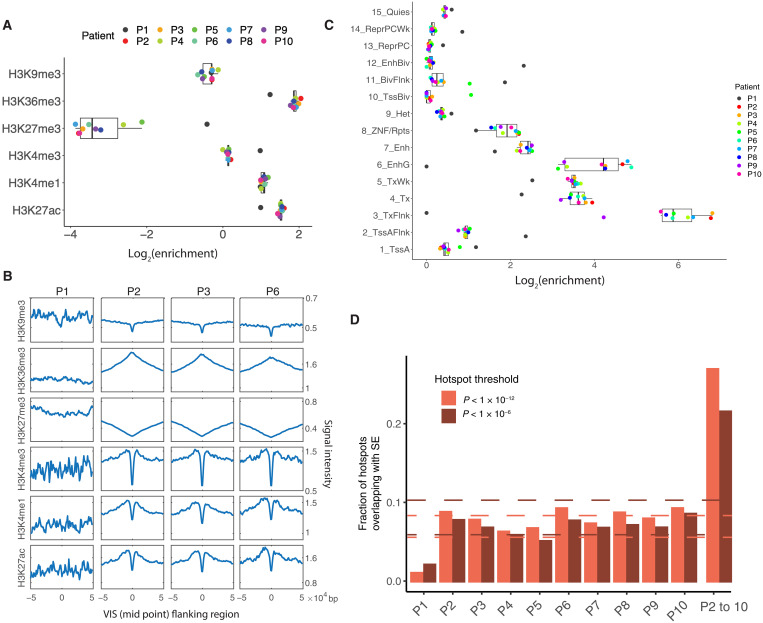
Fig. 2. Epigenomic signatures of lentiviral VIS.
(A) Enrichment of VISs in six histone marks. (B) Aggregation plots showing the signal intensity of six histone marks at the VIS and its flanking regions. (C) Enrichment of VISs in 15 chromatin states. (D) Overlap of hotspots and SEs in all patients. Two sets of hotspots were called on the basis of different thresholds. The overlap was greater with the more stringent threshold (except for patient 1). Dashed lines mark the median ± 1.5 interquartile range. The overlap values corresponding to patient 1 were outliers with both thresholds. Bars are shown for individual patients and for hotspots shared by patients 2 through 10. The overlap between hotspots and SE in patient 1 is significantly different from that of patients 2 to 10 (P = 3.26 × 10⁻⁹ for threshold 10−6 and P = 1.07 × 10⁻⁷ for threshold 10−12, Fisher exact test). Note that the reported values are still higher than the expected overlap by chance, which are less than 0.005.

