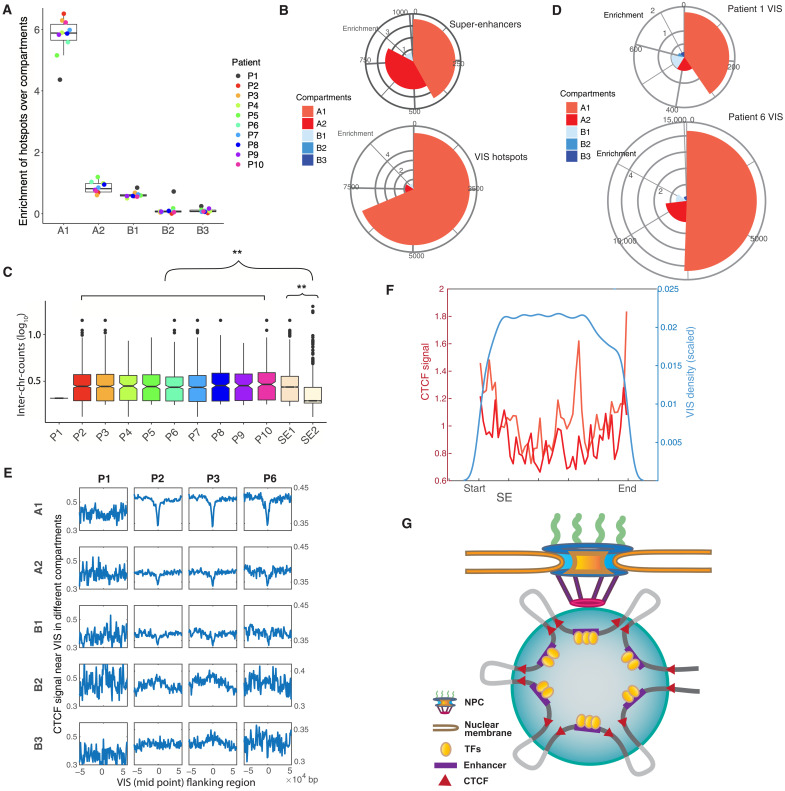
Fig. 3. 3D genome signatures of lentiviral VIS.
(A) Enrichment of hotspots in five compartments. (B) Mapping of SE and VIS hotspots to genome subcompartments. The pies indicate the fraction of VISs mapped to the compartments, with the radii representing the enrichment. The list of hotspots is compiled from all patients except patient 1. (C) Number of interchromosomal read counts between SEs. Only SEs overlapping with hotspots are considered. No boxplot for patient 1 because the number of SEs overlapping with hotspots was low. The number of interchromosomal reads is used as a proxy for spatial proximity. SE1s are in closer proximity than SE2s (P < 2.2 × 10⁻¹⁶, two-sided Wilcoxon test). (D) Mapping of VISs in patients 1 and 6 to the subcompartments. The distribution of VISs in P1 significantly differs from the distribution in P6 (P = 0.0175, Multinomial test, P value was estimated by a Monte Carlo approach). (E) Aggregation plots showing the intensity of CTCF signals at the VISs and their flanking regions at different subcompartments. For patients 2, 3, and 6, VISs were depleted at CTCF sites in compartments A1 and A2 but showed minor enrichment in compartments B2 and B3. (F) VIS density and CTCF signal within SEs. VISs were depleted near the two ends. A strong CTCF signal was observed near the ends of both SE1 and 2. (G) Model of LV integration. After entry into the nucleus through the nuclear pore, the LV integrates into/near SEs interacting with the NPC. Clusters of enhancers are brought together with the binding of multiple transcription factors (TFs). CTCFs at the ends are responsible for forming the whole SE, together with multiple CTCFs forming enhancer-promoter loops. LV integrations occur within SEs, being depleted near the CTCF binding sites but more likely in the regions in between (lightly colored intervals).

