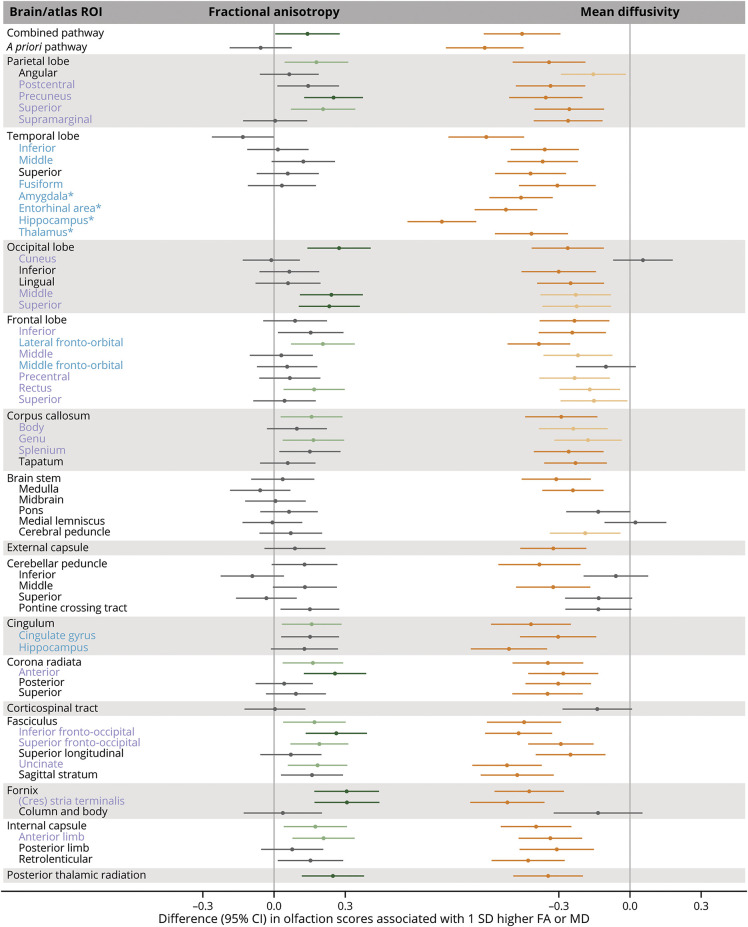
Figure 2. Associations Between Microstructural Integrity of the Brain and Olfaction Score in the Johns Hopkins University Atlas Regions.
β Estimates were obtained from ROI-specific linear regression models with olfaction score as the outcome variable and standardized DTI measure as the independent variable, adjusting for age, sex, center race, education, smoking status, alcohol drinking status, prevalent heart disease, blood pressure status, diabetes, total cholesterol, body mass index, stroke, head injury, APOE ε4 carrier status, and estimated total intracranial volume. Positive β for FA indicates that better microstructural integrity (higher FA) is associated with better olfaction. Negative β for MD indicates that worse microstructural integrity (higher MD) is associated with worse olfaction. Blue text indicates that these regions formed the a priori olfaction pathway ROI. Blue and purple ROIs formed the combined olfaction pathway ROI. Light green and orange data points represent that the associations were significant after correcting for FDR (p ≤ 0.05) for FA and MD, respectively. Dark green and orange data points represent that the associations were significant after correcting for FWER (p ≤ 0.05) for FA and MD, respectively. Please see eTable 1B (links.lww.com/WNL/D26) for details. FA = fractional anisotropy; FDR = Benjamini-Hochberg false discovery rate; FWER = Bonferroni family-wise error rate; GM = gray matter; MD = mean diffusivity; ROI = region of interest; WM = white matter. Note: MD measures for all ROIs except for those with asterisk (*) are WM MD; the ROIs with * are GM MD.

