. 2023 Sep 12;12:e85365. doi: 10.7554/eLife.85365

Figure 1. Ancestral high-sugar diet (HSD) exposure decreased sweet sensitivity and feeding behavior across multiple generations of offspring.

(A) The illustration of experimental design for B-I. The embryos of wild-type Canton-S flies were collected and fed with normal diet (ND) (black, referred to ND controls) or HSD (red, referred to HSD-F0) until maturity. HSD-F0 flies were mated to produce the next generation (HSD-F1). The embryos of HSD-F1 flies were transferred to ND right after egg laying and kept on ND until adulthood. HSD-F1 flies were mated to propagate multiple generations of offspring (HSD-F2 to F5) on ND diet for metabolic and behavioral assays. (B–C) The body weight of individual flies from different treatment groups (n=6 biological replicates, each containing 5 flies). (D–E) Volume of 400 mM sucrose consumed by individual flies using the Manual Feeding (MAFE) assay (n=10–12). (F) Schematic illustration of the proboscis extension reflex (PER) assay. (G–I) Fractions of flies showing PER responses to different concentrations of sucrose (n≥6 biological replicates, each containing 8–12 flies). The S50 indicated the sucrose concentration that induced PER responses in 50% of the tested flies. Data were shown as means ± SEM. ns p>0.05; *p<0.05; **p < 0.01; ***p < 0.001; ****p < 0.0001.

Figure 1—source data 1. Raw data of the metabolic and behavioral experiments shown in Figure 1.

Figure 1.

Figure 1—figure supplement 1. Ancestral high-sugar diet (HSD) exposure induced metabolic changes in the offspring.

Figure 1—figure supplement 1.

(A–C) The levels of triglyceride (A), glycogen (B), and trehalose (C) of individual female flies of the indicated groups (normalized with normal diet [ND] flies, n=8–15 biological replicates, A and C containing 5 flies, B containing 40–60 flies). (D–E) mRNA expression levels of Dilp2 (D) and Dilp5 (E) in the head tissues of indicated flies by qPCR (n=6–9 biological replicates, each containing 15 flies). Data are shown as means ± SEM. ns p>0.05; *p<0.05; **p < 0.01; ***p < 0.001; ****p < 0.0001.
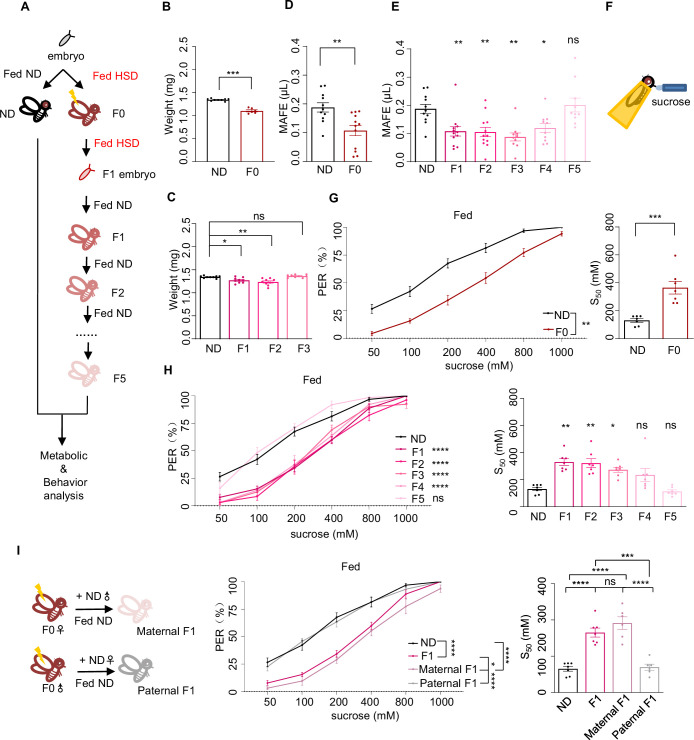
Figure 1—figure supplement 1—source data 1. Raw data of the metabolic and qPCR experiments shown in Figure 1—figure supplement 1.
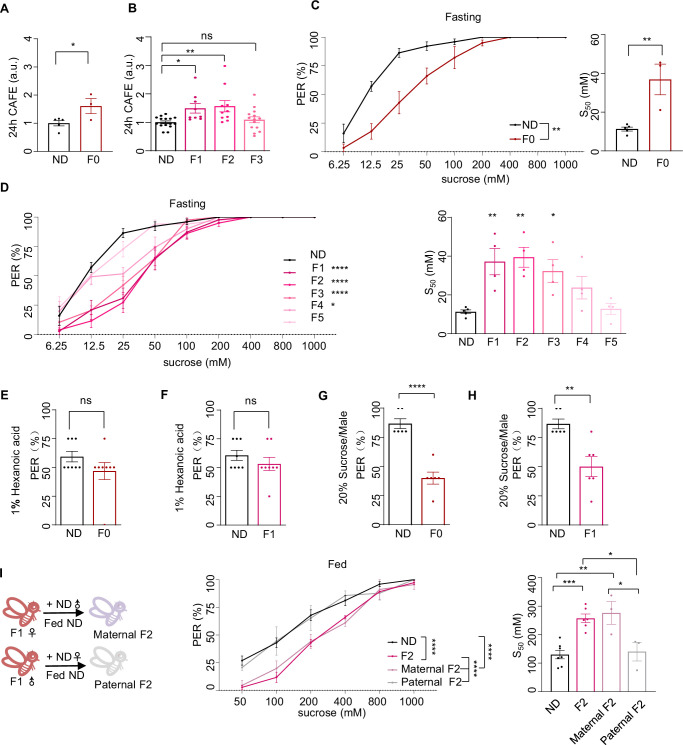
Figure 1—figure supplement 2. Ancestral high-sugar diet (HSD) exposure induced behavioral changes in the offspring.

Figure 1—figure supplement 2.

(A–B) Volume of 20% sucrose consumed by indicated flies during 24 hr using the Capillary Feeder (CAFE) assay (normalized with normal diet [ND] flies, n=3–15 biological replicates, each containing 20 flies). (C–D) Fractions of indicated flies showing proboscis extension reflex (PER) responses to different concentrations of sucrose (n=3–6 biological replicates, each containing 8–12 flies). The S50 indicated the sucrose concentration that induced PER responses in 50% of the tested flies. The flies in B and C were pre-starved for 12 hr (fasting) before the assay. (E–F) Fractions of flies showing PER responses to 1% hexanoic acid (n=8, each containing 5 flies). (G–H) Fractions of male flies showing PER responses to 20% sucrose (n=6, each containing 5 flies). (I) Fractions of indicated flies showing PER responses to different concentrations of sucrose (n=3–6 biological replicates, each containing 8–12 flies). The S50 indicated the sucrose concentration that induced PER responses in 50% of the tested flies. Data were shown as means ± SEM. ns p>0.05; * p<0.05; **p < 0.01; ***p < 0.001; ****p < 0.0001.
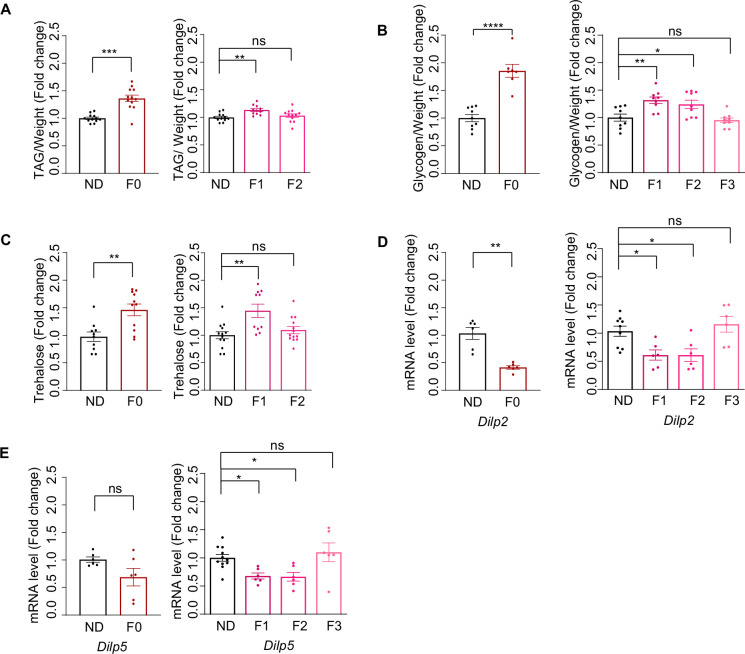
Figure 1—figure supplement 2—source data 1. Raw data of the metabolic and behavioral experiments shown in Figure 1—figure supplement 2.