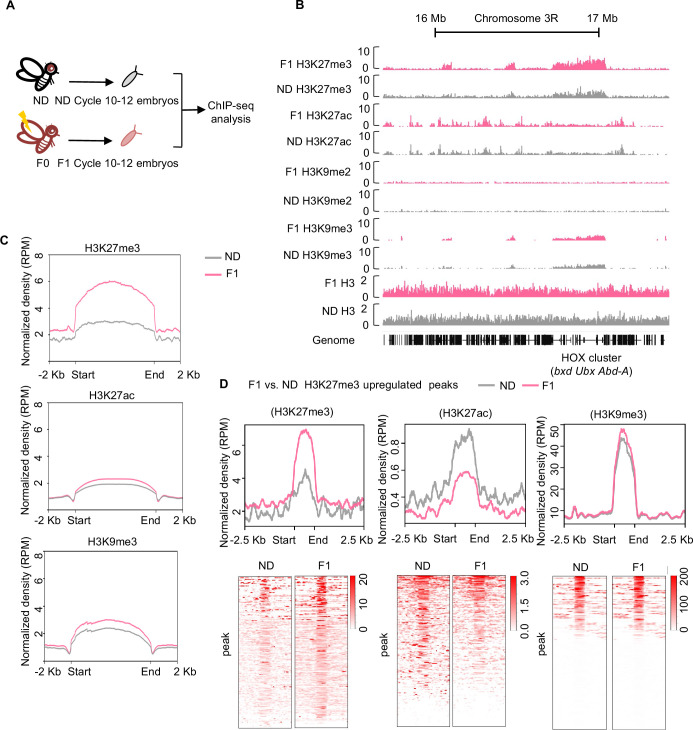
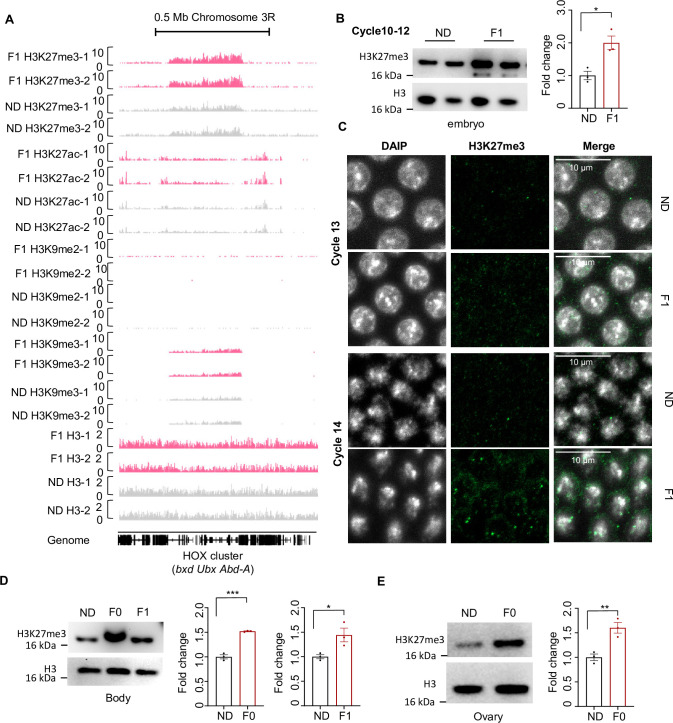
Figure 2. Ancestral high-sugar diet (HSD) exposure increased genome-wide H3K27me3 levels in the offspring.
(A) The workflow of the chromatin-immunoprecipitation followed by sequencing (ChIP-seq) assay. Embryos of normal diet (ND) and HSD-F1 flies were collected from population cages at 25°C for 30 min, and allowed to develop for 80 min to target mitotic cycle 10–12 for ChIP-seq analysis. (B) Genome browser view of H3K27me3, H3K27ac, H3K9me2, H3K9me3, and H3 density at the HOX cluster (bxd, Ubx, and Abd-A) gene regions in embryos of ND and HSD-F1 embryos. (C) Average density plots showing the signal profiles of H3K27me3, H3K27ac, and H3K9me3 at their peaks plotted across a 4 kb window (±2 kb around the start/end of signals). (D) Average density plots (top) and heatmap (bottom) showing the distribution for the changes of H3K27me3, H3K27ac, and H3K9me3 signals for regions with upregulated H3K27me3 peaks in HSD-F1 embryos, respectively. Color bar showed the Z-score value in the heatmap.


