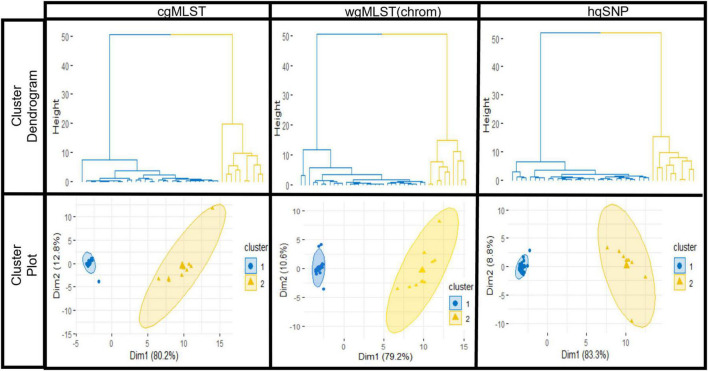
FIGURE 5.
K-means analysis results for one representative outbreak (outbreak 03) using cgMLST, wgMLST (chrom), and hqSNP pairwise genomic differences. Top row: hierarchical clustering results of the dataset show partitioning of outbreak (blue) isolate sequences and sporadic (orange) isolate sequences. Bottom row: elliptical cluster plots show outbreak (blue) and sporadic (orange) isolates plotted separately on a two-dimensional plane, with ellipses fit to the points in the two clusters. On elliptical plots, the sum of values on the x and y-axis scales indicate that a principle component analysis (Ding and He, 2004) accounts for 93.0% (cgMLST), 89.8% [wgMLST(chrom)], and 92.1% (hqSNP) of variation.

