Figure S1.
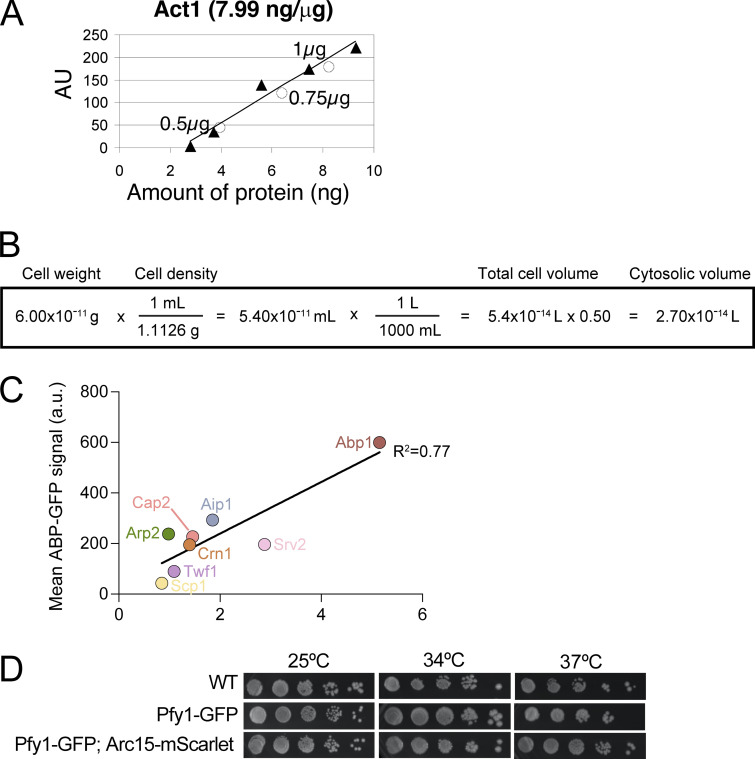
Strategy for quantifying cellular concentrations of S. cerevisiae ABPs. (A) Example standard curve for quantifying the cellular abundance of actin. Signals (AU) on immunoblots for known quantities of purified actin were plotted (filled triangles) to generate a standard curve. Signals from different quantities of total cell lysate on the same immunoblot were plotted (open circles) to determine the amount of actin in the lysates (ng per µg total protein). (B) Calculation of the cytosolic volume of a haploid S. cerevisiae cell using known values for the weight and density of a haploid yeast cell (Baldwin and Kubitschek, 1984; Sherman, 2002). (C) Standard curve used to estimate the cellular concentrations of Pfy1-GFP and Abp140-GFP, since we did not have reliable antibodies for Pfy1 or Abp140. For eight ABPs, confocal microscopy was used to determine total ABP-GFP concentrations in cells. These values were plotted against cellular concentrations determined by quantitative Western blotting (as in B; also see Materials and methods). Linear regression was used to generate the line shown, which has an equation (y = 102× +35.22) from which we estimated the cellular concentrations of Pfy1 and Abp140. (D) A C-terminal GFP tag on profilin (Pfy1) does not compromise growth at the indicated temperatures. Serial dilutions comparing three strains (WT, Pfy1-GFP, and Pfy1-GFP Arc15-mScarlet) grown on YPD plates for 48 h at 25°C, 34°C, and 37°C.

