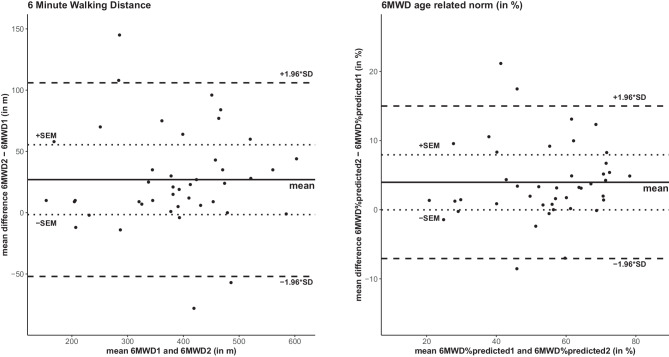
Fig. 2.
Bland Altmann plots for the difference between two 6MWTs at the initial assessments. Note that 46 LuTXr completed the retest on the second test day before postacute rehabilitation started. Solid line mean difference test 1 and 2; dashed line coefficient of variability (±1.96 * SD); dotted line: measurement error. 6MWD distance walked in the 6MWT, 6MWD%pred the predicted walking distance (6MWD), 6MWD1 and 6MWD2 first and second 6MWT

