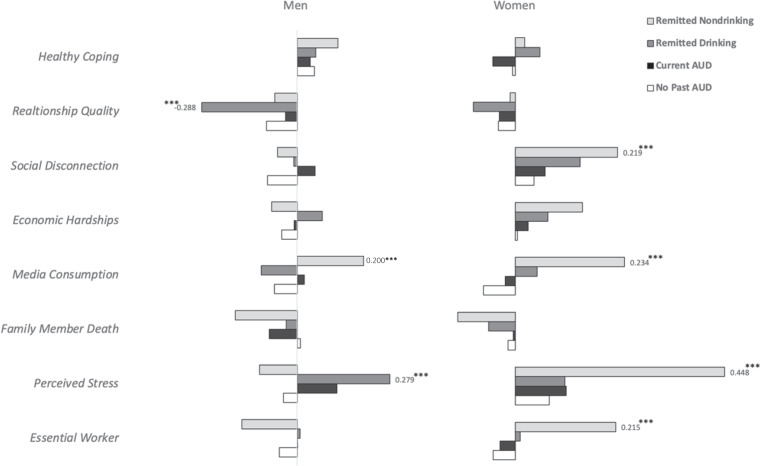
Fig. 3. Risk and protective factors associated with reported increases in drunkenness frequency since March 2020 among COGA men and women, by pre-pandemic AUD status.
The primary outcome variable used in the analytic models was determined using a retrospective question asking if/how current alcohol use differed from the participant’s typical frequency of drunkenness prior to March 1, 2020 (“Compared to your [frequency of drunkenness] before the pandemic began in March 2020, was this: [the same, less, more]?”). This was recomputed to represent whether the participant’s frequency of drunkenness was reduced from pre-pandemic levels (−1), the same as pre-pandemic levels (0), or increased from pre-pandemic levels (1). This figure depicts group-level “change” in terms of increased frequency of drunkenness since the beginning of the pandemic (beta coefficients ranging from 0 to 0.50, right-hand side of the figure) or decreased frequency of drunkenness since the beginning of the pandemic (beta coefficients ranging from 0 to −0.30, left-hand side of the figure).

