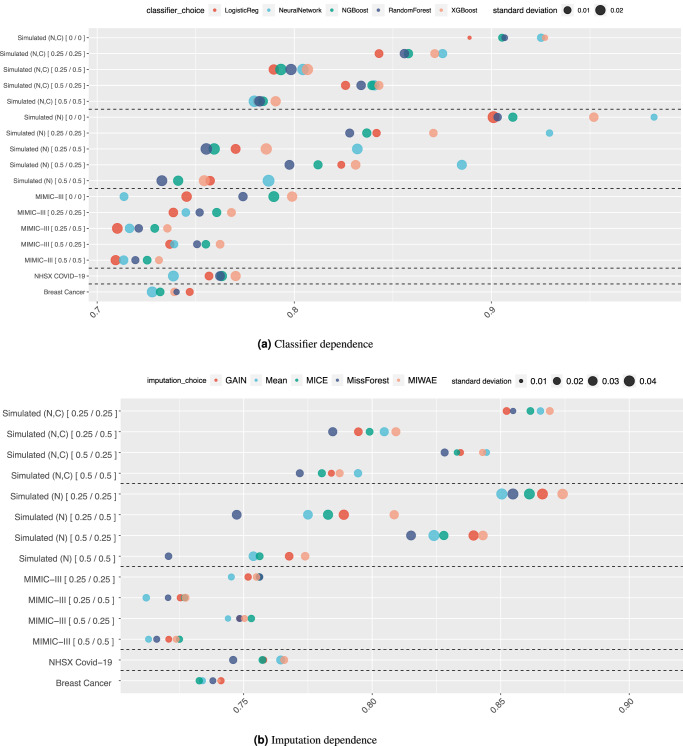
Fig. 3. Dependence of downstream classification AUC performance on classification and imputation methods.
These plots show the dependence of the downstream performance on the a classification and b imputation methods. For the Simulated (N), Simulated (N,C) and MIMIC-III datasets, we show performance for 25% and 50% levels of missingness in the development and test data. Datasets are separated by dashed lines from each other. The size of each marker corresponds to the standard deviation in the results, and the values after each dataset name indicate the [train/test] missingness.

