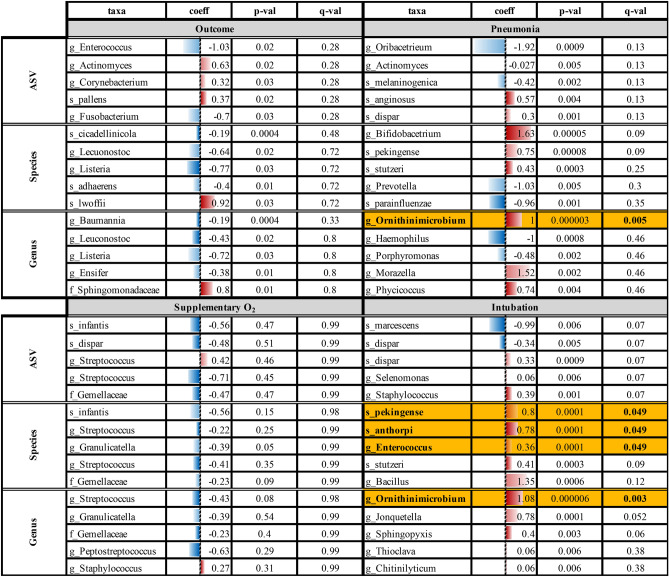
Table 3.
MaAsLin2 top 5 DA taxa (based on q values). In each panel, corresponding to a covariate, coefficient, p values and q values for each taxon are reported on columns at different taxonomic resolution, namely: ASV, Species and Genus on rows. Covariates tested: Outcome (symptomatic or asymptomatic); Pneumonia (mild, moderate or severe); Supplemental O2 and Intubation (yes or no). Taxa with statistically significant q values (< 0.05) are highlighted in bold with a golden background. Coefficient values are graphically resumed with a blue (less abundant) to red (more abundant) color scale, ranging from − 2 to 2. For greater clarity, taxa names were reported according to the last taxonomic level classified during the read preprocessing.

