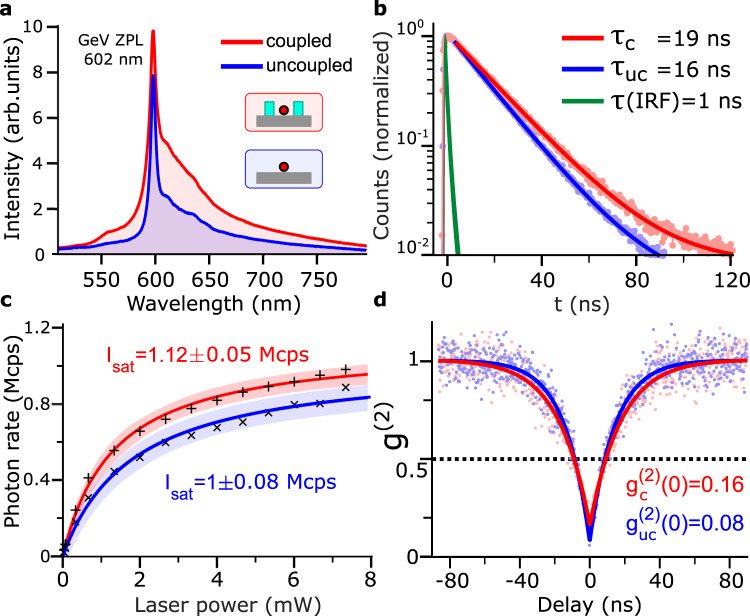
Fig. 4. Characterization of GeV-ND emission.
a Emission spectra of GeV-ND center characterized before (blue) and after (red) coupling to the metasurface featuring the resonant peak at 602 nm. b Lifetime measurements using a pulsed laser with 1 MHz rate show single-exponent emission decays along with the instrument response function (IRF). c Emission rate power-saturation dependencies. Error boundaries (shadow regions) represent 95% fitting confidence intervals. d Correlation data and a model fit to the g(2) correlation function. In figures (b–d) dots, plus signs and crosses represent raw data and solid lines represent fitting curves.

