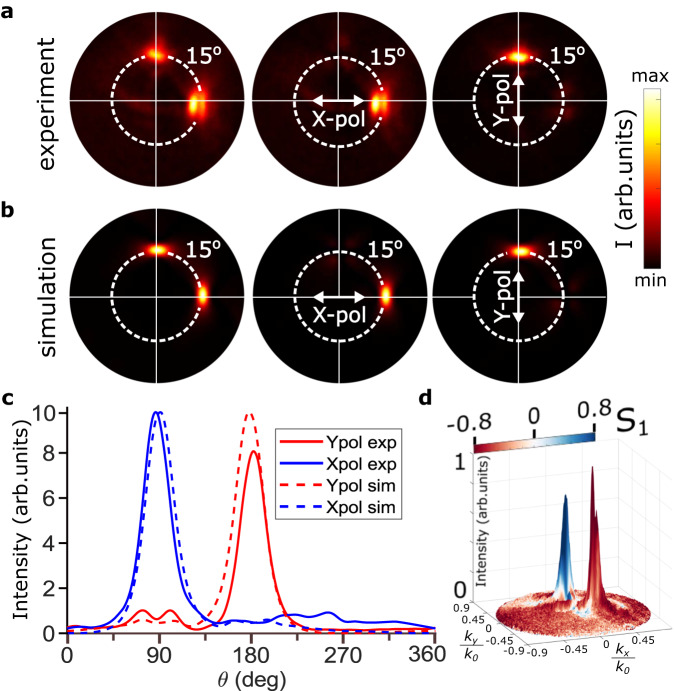
Fig. 5. Angular and polarization emission distribution.
a Fourier-plane emission images collected with NA = 0.9 objective from the GeV-ND coupled to the holographic metasurface. From left to right: images taken without analyzer, with analyzer parallel to X-axis, and to Y-axis of the metasurface. b Corresponding simulated far-field intensity distributions. Dashed circles mark 15° angular displacements from the normal to the surface. c Intensity circular cross section distributions (along the dashed lines) showing clear separation between X- and Y-polarized emission channels. d 3D representation of the superimposed experimental distributions of emission intensity (height) and polarization (colour) represented by stokes parameter S1. The angular coordinates kx/k0 and ky/k0 are x- and y- wavevector projections on the image plane normalized to the free space wavevector.

