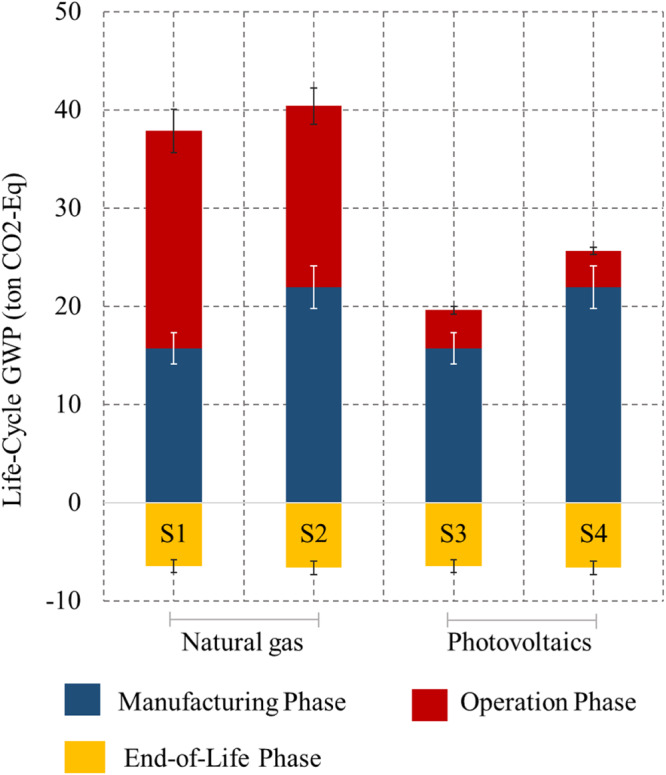
Fig. 1. Global warming potential results.

Data are presented as mean values of a population size of n = 10,000 (Bootstrapping samples) life cycle phase emissions, while error bars in the form of standard deviations for each scenario are shown to illustrate the dispersion of data points. The lower and upper bounds for each scenario are mentioned as follows (Lower bound, Upper bound); Scenario 1: Manufacturing phase: (8.66, 27.05), Operation phase: (14.69, 26.63), End-of-Life phase: (−8.32, −2.59); Scenario 2: Manufacturing phase: (11.65, 37.56), Operation phase: (12.13, 22.08), End-of-Life phase: (−8.56, −2.66); Scenario 3: Manufacturing phase: (8.66, 27.05), Operation phase: (2.06, 6.68), End-of-Life phase: (−8.32, −2.59); Scenario 4: Manufacturing phase: (11.65, 37.56), Operation phase: (1.91, 6.5), End-of-Life phase: (−8.56, −2.66). The Standard Deviation values are as follows; Scenario 1: Manufacturing phase: 4.55, Operation phase: 3.83, End-of-Life phase: 1.59; Scenario 2: Manufacturing phase: 6.4, Operation phase: 3.15, End-of-Life phase: 1.64; Scenario 3: Manufacturing phase: 4.55, Operation phase: 1.13, End-of-Life phase: 1.59; Scenario 4: Manufacturing phase: 6.4, Operation phase: 1.12, End-of-Life phase: 1.64.
