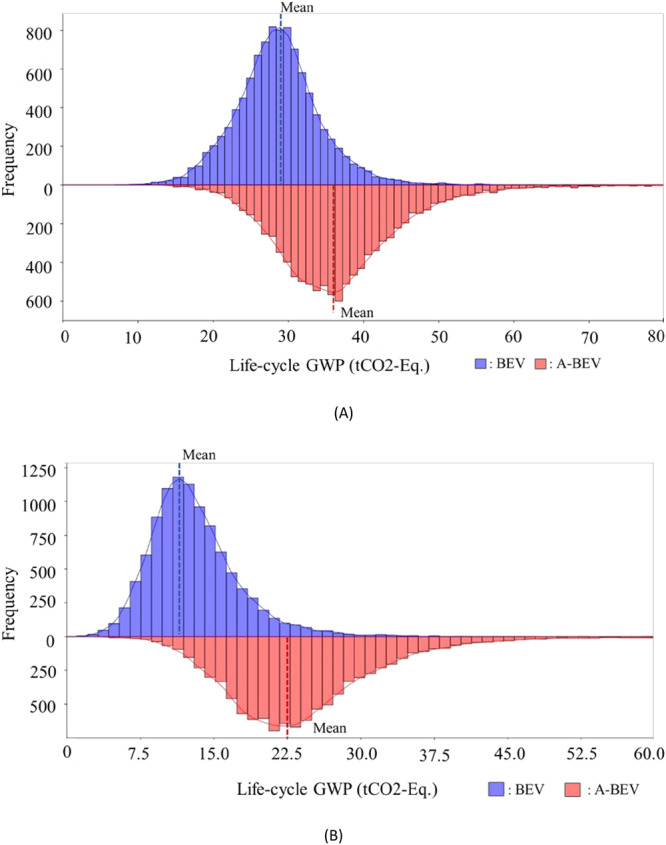
Fig. 3. Monte Carlo simulation results.

A Scenarios 1 and 2. B Scenarios 3 and 4. This analysis aids in accounting for the various sources of uncertainty within life cycle emissions of both autonomous and nonautonomous vehicles by considering numerous samples of 10,000 emissions sample values from the simulations. The two graphs provide a holistic view of the life cycle emissions of autonomous and nonautonomous vehicles by highlighting their potential difference and how they are likely to be as the simulation accounts for various uncertainties within the life cycle. %95 confidence interval on the mean are as follows: Scenario 1: (28.6, 28.8), Scenario 2: (36.6, 36.9), Scenario 3: (12.9, 13.1), Scenario 4: (24, 24.3). BEV battery electric vehicles, A-BEV autonomous battery electric vehicles. The standard deviation for S1 and S2 in (A) are 5.8 and 5.59, respectively, while for S3 and S4 in (B) they are 4.75 and 8.19, respectively.
