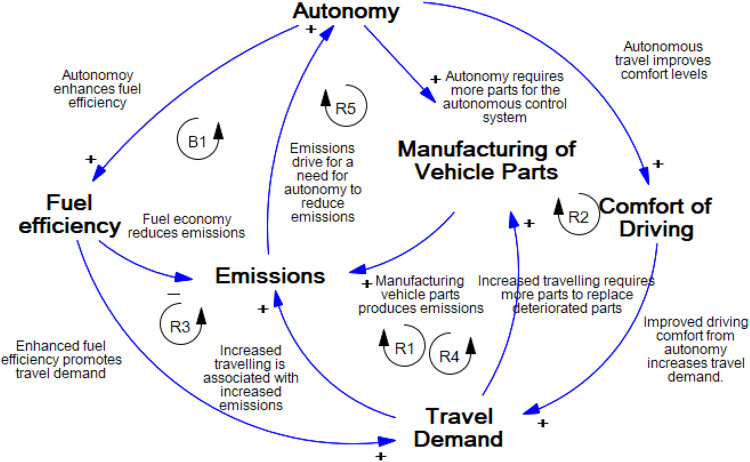
Fig. 5. Causal loop diagram model.
This figure represents the causal relationships between model variables explaining the rebound effects in the context of integrating autonomy into vehicles. There are four reinforcing loops contributing to an increase in life cycle emissions through increased vehicle travel and maintenance, while a balancing loop counteracts this effect by reducing life cycle emissions through enhanced fuel efficiency due to autonomy.

