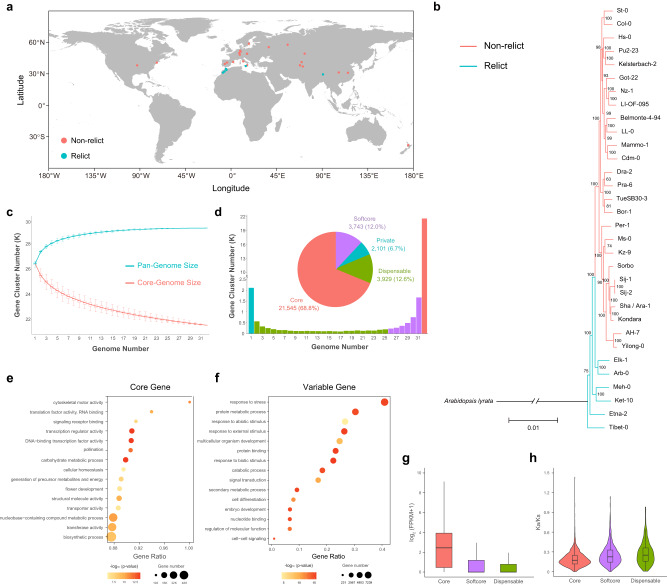
Fig. 1. Pan-genome of 32 A. thaliana ecotypes.
a Geographic distribution of 32 selected ecotypes of A. thaliana. The red circles represent non-relict ecotypes while the blue circles represent relict ecotypes. b Phylogenetic tree of 32 A. thaliana ecotypes with A. lyrata as the outgroup. Bootstrap values (%) are displayed on each branch. The red branches represent non-relict ecotypes while the blue branches represent relict ecotypes. c Pan-genome and core genome size simulated by gene cluster number and pan-genome composition. The upper and lower edges of the boxes represent the 75% and 25% quartiles, respectively, while the central line denotes the median, and the whiskers extend to 1.5× the inter-quartile range (IQR). The sample size was set to 1000 and the sample repeat was set to 30. d Number and percentage of core, softcore, dispensable, and private gene clusters. e Bubble chart of gene ontology (GO) enrichment analysis for core genes. Significance was tested by two tailed Fisher’s exact test method. f Bubble chart for the GO enrichment analysis of variable genes. Significance was tested by two tailed Fisher’s exact test method. g Expression levels of genes belonging to core (n = 709,766), softcore (n = 125,555), and dispensable (n = 50,237) gene families. h Pairwise nonsynonymous/synonymous substitution ratios (Ka/Ks) within core (n = 709,766), softcore (n = 125,555), and dispensable (n = 50,237) genes. The upper and lower edges of the boxes represent the 75% and 25% quartiles, the central line denotes the median, and the whiskers extend to 1.5× IQR in g and h. Source data are provided as a Source Data file.

