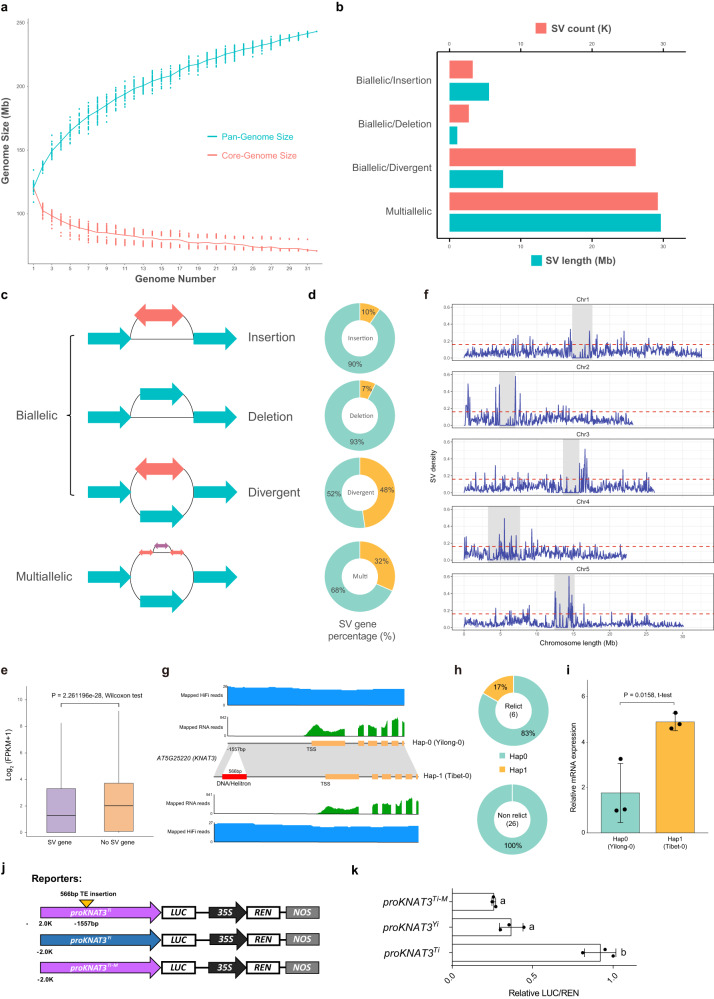
Fig. 3. Characterization of the graph genome across 32 de novo genomes of A. thaliana.
a The graph pan-genome size changes with the increase in number of genome assemblies. b The bar chart shows the number (red) and length (blue) of each type of structural variation (SV) separately. c Schematic illustration of diverse SV types from the graph pan-genome based on the reference genome Col-0. d The pie chart shows the number of genes affected by SV as a proportion of the overall number of genes. e Expression levels of SV-overlapped genes (n = 18,883) and non-SV-overlapped (n = 9852) genes. The upper and lower edges of the boxes represent the 75% and 25% quartiles, the central line denotes the median, and the whiskers extend to 1.5× the inter-quartile range (IQR). Significance was determined using a two tailed Wilcoxon test with p = 2.261196e-28 < 0.05. f SV density along each chromosome based on Col-0 genome assembly: (50 Kb sliding windows with a step-size of 20 Kb in blue). Gray rectangles: centromeres. The dashed red lines indicate thresholds for SV density values of in the top 5%. g Two haplotypes of KNAT3 are determined by the presence or absence of DNA/Helitron insertion (red bar) in the promoter region. HiFi and RNA-seq read mapping supports the gene structure annotation. TSS: transcription start site. h The distributions of the two haplotypes of KNAT3 in relict and non-relict ecotypes. i Relative KNAT3 mRNA levels as assessed by quantitative RT-PCR. Data are mean ± SD from independent biological replicates (n = 3). Significance was determined using a two tailed t-test with p = 0.0158 < 0.05. j Schematic diagram of reporters of transient dual-luciferase assay. k Transient dual-luciferase assay in N. benthamiana. LUC: Firefly Luciferase; REN: Renilla Luciferase; NOS: NOS terminator. Data are mean ± SD from independent biological replicates (n = 3). The letters ‘a’ and ‘b’ indicate statistically significant differences by one-way ANOVA Duncan’s test (p = 0.001926 and 0.006574 < 0.05). Source data are provided as a Source Data file.

