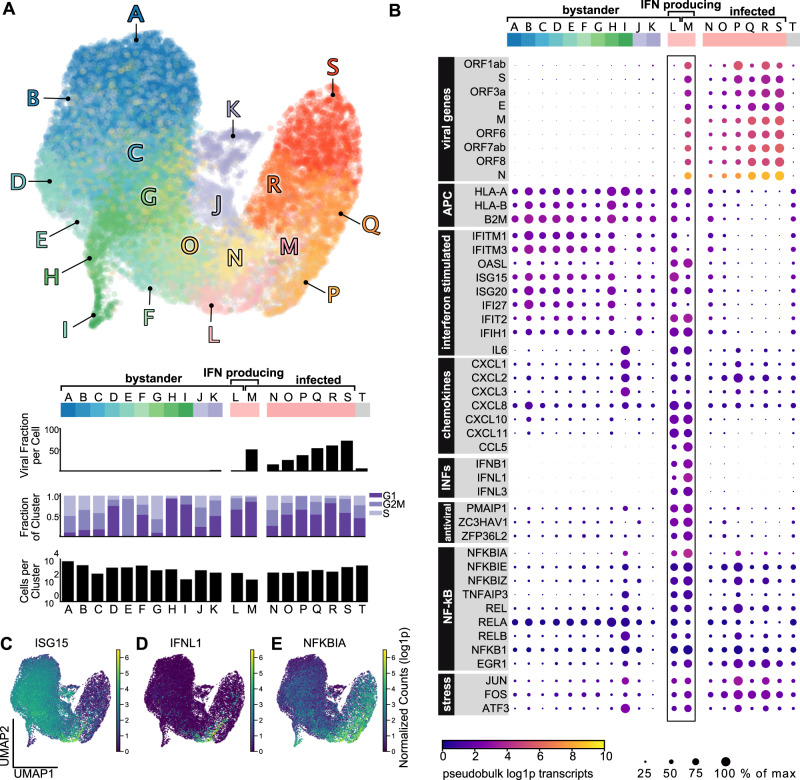
Fig. 2. Transcriptional heterogeneity in SARS-CoV-2 infection.
A Single-cell transcriptomes were projected in UMAP space and colored by Leiden cluster. Leiden clusters were subsequently characterized by the mean viral fraction, the number of cells, and the cell cycle composition per cluster. Cluster T are all cells that could not be assigned an unambiguous infection state. B Differential expression of Leiden clusters revealed transcriptionally distinct subclusters of bystander cells, infected cells, and a small subset of interferon-producing cells. The color of each dot is pseudobulk gene expression of each gene per cluster, and the size of each dot is the expression normalized to the cluster with maximum expression of that gene. C–E Host transcriptional analysis revealed heterogeneity in infected and bystander populations, including differential gene expression in UMAP space of: C ISG15; D IFNL1; and E NFKBIA.

