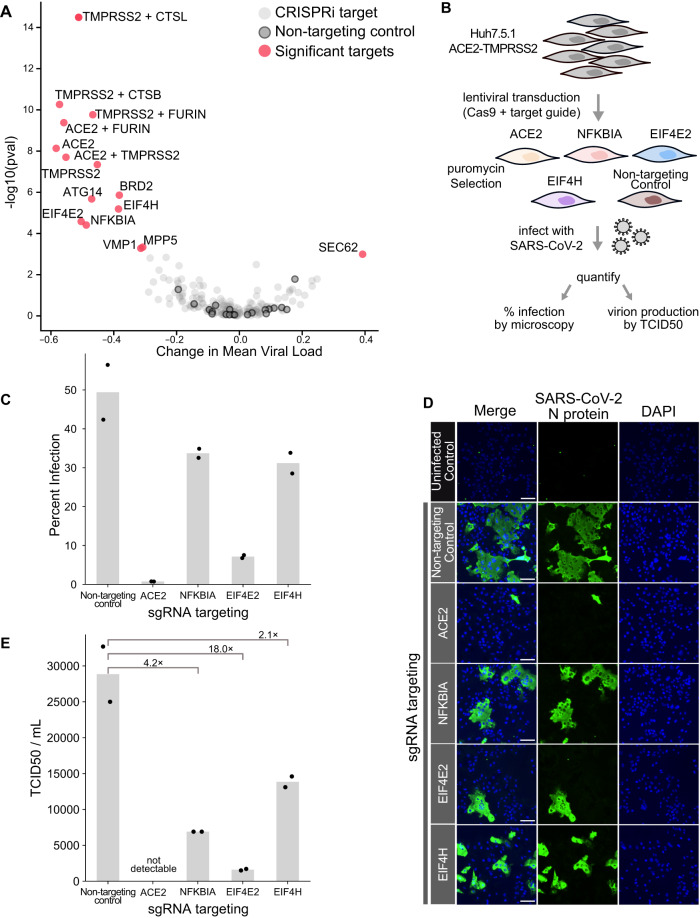
Fig. 3. Host perturbations alter SARS-CoV-2 infection dynamics.
A The effect of how each CRISPRi perturbation altered viral load was displayed as the change in mean viral load by KS p-value (Kolmogorov–Smirnov test, two-sided) of viral load distribution change. Color code indicates CRISPRi targets, non-targeting controls, and targets in which knockdown significantly altered viral loads. B To orthogonally validate CRISPRi targets, we transduced Huh7.5.1 cells overexpressing ACE2 and TMPRSS2 with lentivirus targeting control and test genes. Cells were subsequently infected with SARS-CoV-2, and percent infection was calculated (C) by immunofluorescence and microscopy (D), counting the fraction of cells positive for SARS-CoV-2 nucleoprotein. Original images were taken on an inverted fluorescence microscope at 4× (>2000 cells). Representative, zoomed-in fields of view are shown and the scale bar represents 100 µm. In the bar plot, each bar represents the mean percent infection for a given cell line and points represent the individual data points. Additionally, we quantified infectious virion production using the TCID50 assay and calculated fold change for each cell line relative to the mean TCID50/mL of non-targeting control cells. E In the bar plot, each bar represents the mean TCID50/mL for a given cell line, and the points represent the individual data points. The ACE2 knockout positive control was measured once for the TCID50 assay; two biological replicates were performed for all other infection conditions (C–E). Source data for orthogonal validation are provided as a Source Data file.

