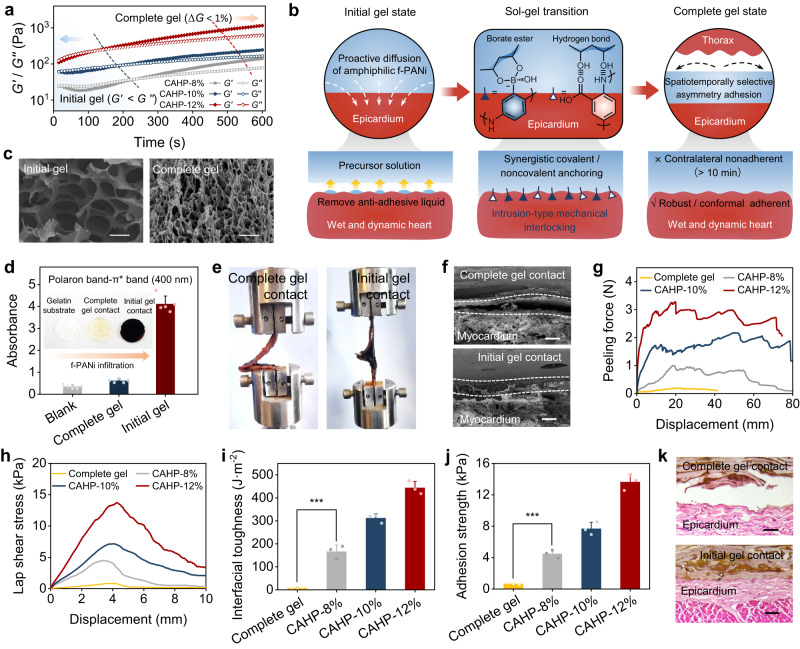
Fig. 3. Chronological adhesion performance and mechanism of CAHP.
a Storage modulus (G′) and loss modulus (G′′) variation of CAHPs during hydrogel gelation. b Chronological adhesion mechanism of the CAHP. c SEM images of the network structure of CAHPs in the initial and complete gel states. Scale bars, 100 μm (left) and 5 μm (right). d Absorbance at 400 nm of f-PANi infiltrated gelatin substrates during the initial and complete gel states (n = 5 independent experiments). e Peeling adhesion photographs when CAHPs in the initial and complete gel states are in contact with porcine myocardium for 10 min. f SEM images of the hydrogel–tissue interface. The white dotted line outlines the cross-section between the epicardium and CAHP. Scale bars, 20 μm. g, h Representative force–displacement curves for hydrogel–tissue hybrids in peeling (g) and lap-shear tests (h). i, j Interfacial toughness (i) and adhesion strength (j) between CAHPs and porcine myocardium (n = 3 independent experiments). k Hematoxylin-eosin-stained images at the contact interface between CAHPs and the epicardium. Scale bars, 20 μm. CAHP: chronological adhesive hydrogel patch. The measurements in (c, f, k) were repeated three times independently with similar results. Data are presented as the mean ± standard deviation in (d, i, j) and were analyzed using one-way ANOVA with Tukey’s post hoc test in (i, j), ***p < 0.001. i p = 7.34 × 10⁻⁴ (Complete gel vs CAHP-8%). j p = 2.04 × 10⁻⁴ (Complete gel vs CAHP-8%).

