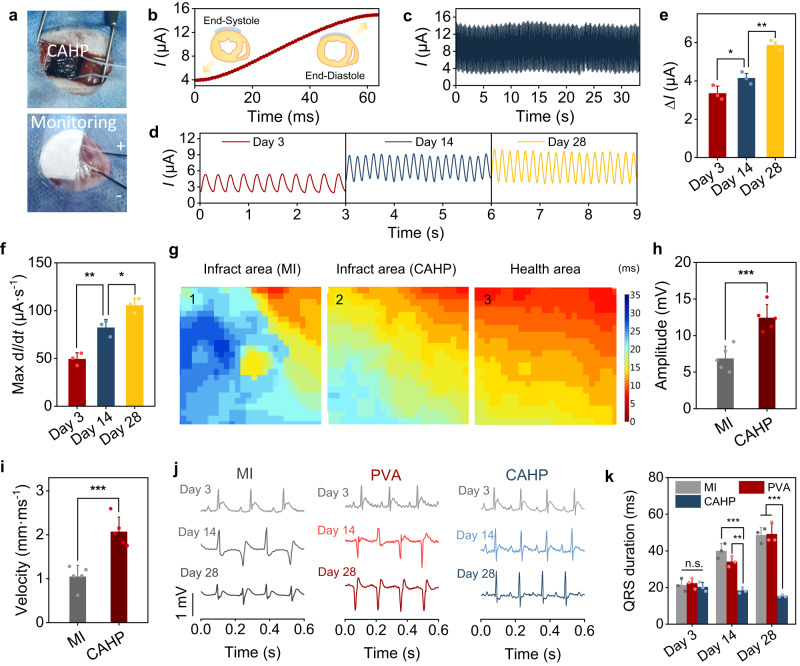
Fig. 6. Cardiac mechanophysiology monitoring and electrocoupling treatment by CAHP.
a Photographs of CAHP affixed to the left ventricular surface and mechanophysiological monitoring. b Current variation in CAHP from cardiac end-systole to end-diastole. c Current variation curve during CAHP monitoring of healthy hearts. d Current curves in the CAHP were recorded on days 3, 14, and 28 after MI. e The difference (∆I) between the peak and minimum currents (n = 3 animals). f The maximum value (Max dI/dt) of current variation in each stroke (n = 3 animals). g Heatmap of the activation time of calcium transient signals from the apices propagating to different regions of the heart. h, i Physiological potential amplitude (h) and average conduction velocity (i) in the MI and CAHP groups (n = 5 animals). j Representative ECGs for rats in the MI, PVA, and CAHP groups at 3, 14, and 28 days postoperatively. k QRS interval duration (n = 3 animals). MI myocardial infarction, PVA: polyvinyl alcohol, CAHP chronological adhesive hydrogel patch. Data are presented as the mean ± standard deviation and were analyzed using one-way ANOVA with Tukey’s post hoc test in (e, f, h, i, k), n.s.: no significant difference at p > 0.05, *p < 0.05, **p < 0.01, ***p < 0.001. e p = 0.0484 (Day 3 vs Day 14), p = 1.71 × 10⁻³ (Day 14 vs Day 28). f p = 6.04 × 10⁻³ (Day 3 vs Day 14), p = 0.0239 (Day 14 vs Day 28). h p = 9.90 × 10⁻⁴ (MI vs CAHP). i p = 6.12 × 10⁻⁴ (MI vs CAHP). k Day 3: p = 0.726 (MI vs PVA), p = 0.427 (PVA vs CAHP), p = 0.709 (MI vs CAHP). Day 14: p = 9.34 × 10⁻⁴ (MI vs CAHP), p = 1.05 × 10⁻³ (PVA vs CAHP). Day 28: p = 1.63 × 10⁻⁴ (MI vs CAHP), p = 5.03 × 10⁻⁴ (PVA vs CAHP).

