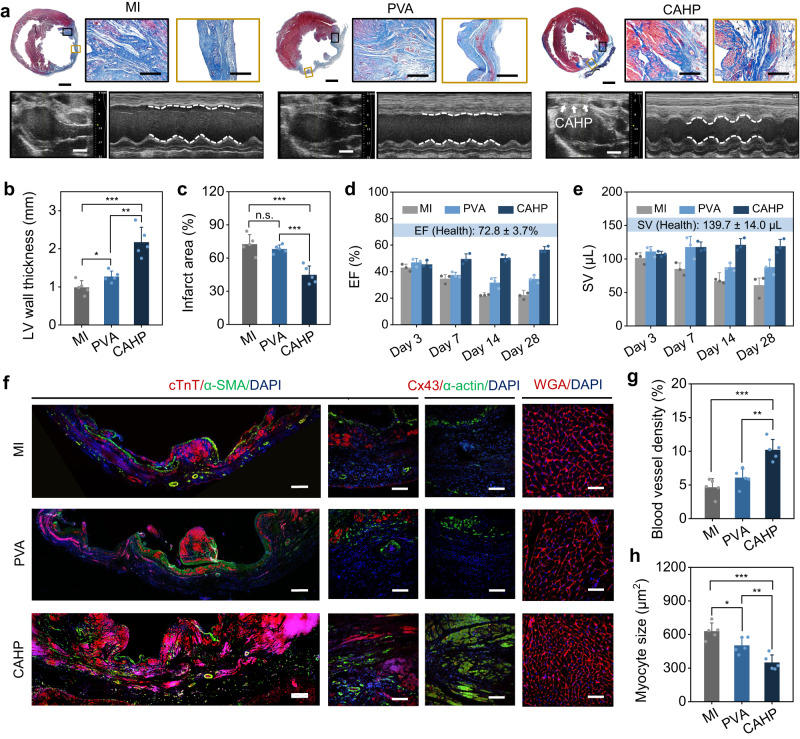
Fig. 7. Myocardial repair effects of CAHP.
a Masson staining for collagen (blue) and muscle (red) and echocardiography imaging in the MI, PVA and CAHP groups. White arrows represent CAHP on the epicardium, and the white dotted line outlines diastolic-systolic ventricular dimension changes. Measurements of Masson staining and echocardiography were repeated independently five and three times, respectively, with similar results. b, c Quantitative analysis of the wall thickness (b) and infarcted area (c) in the MI, PVA, and CAHP groups (n = 5 animals). d, e The ejection fraction (EF) (d) and stroke volume (SV) (e) of the left ventricle after 3, 7, 14, and 28 days postoperatively in the MI, PVA, and CAHP groups (n = 3 animals). f Representative immunofluorescence staining of the infarct region in the MI, PVA, and CAHP groups for cardiac markers (cTnT and α-actin), vascularization marker (α-SMA), intercellular electrical contraction coupling marker (Cx43), cardiomyocyte profiles (WGA), and nuclei (DAPI). g, h Quantitative analysis of blood vessel density (g) and myocyte size (h) (n = 5 animals). Scale bars, 2 mm in overall view, 300 μm in border and infarct area, and 4 mm in echocardiography (a); 300 μm (left) and 100 μm (right) in cTnT/α-SMA staining, 100 μm in Cx43/α-actin staining, and 50 μm in WGA staining (f). MI myocardial infarction, PVA: polyvinyl alcohol, CAHP chronological adhesive hydrogel patch. Data are presented as the mean ± standard deviation in (b, c, d, e, g, h) and were analyzed using one-way ANOVA with Tukey’s post hoc test in (b, c, g, h), n.s.: no significant difference at p > 0.05, *p < 0.05, **p < 0.01, ***p < 0.001. b p = 0.0241 (MI vs PVA), p = 1.29 × 10⁻³ (PVA vs CAHP), p = 2.66 × 10⁻⁴ (MI vs CAHP). c p = 0.332 (MI vs PVA), p = 3.51 × 10⁻⁴ (PVA vs CAHP), p = 7.67 × 10⁻⁴ (MI vs CAHP). g p = 2.74 × 10⁻⁴ (MI vs CAHP), p = 1.79 × 10⁻³ (PVA vs CAHP). h p = 0.0232 (MI vs PVA), p = 2.45 × 10⁻⁴ (MI vs CAHP), p = 8.27 × 10⁻³ (PVA vs CAHP).

