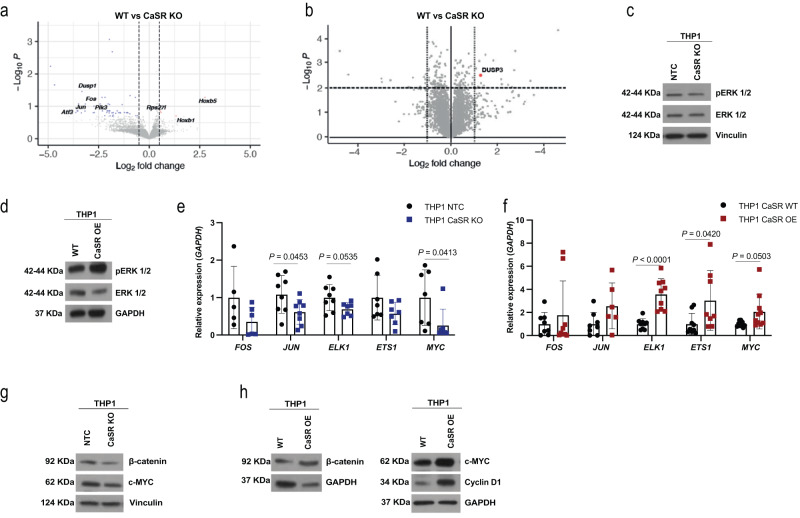
Fig. 4. CaSR activates MAPK and Wnt-β-catenin.
a, b Differentially expressed genes (a) and proteins (b) in sorted Lin− MLL-AF9+ cells from the BM of WT (Mx1-Cre−/− CaSR flox/flox) mice transplanted with WT or CaSR KO (Mx1-Cre± CaSR flox/flox) MLL-AF9+ leukaemia-initiating cells. Each protein is represented by a dot, which is mapped according to its statistical significance (P value) versus magnitude of change (fold change). c, d Expression of ERK 1/2 and phospho ERK 1/2 (pERK1/2 (Thr 202/Tyr 204)) in lysates of THP1 non-target control (NTC) versus THP1 CaSR KO (c) and THP1 WT versus THP1 CaSR OE cells (d). The images are representative of three (c) or 6 (d) independent experiments. e, f Relative expression of pERK1/2 target genes in THP1 NTC versus THP1 CaSR KO cells (e) (n = 8, two-way ANOVA, Sidak’s test, mean ± SD) and THP1 WT versus THP1 CaSR OE cells (n = 9, two-way ANOVA, Sidak’s test, mean ± SD) (f). n refers to biological replicates. g Expression of β-catenin and c-MYC in lysates of THP1 WT and THP1 CaSR KO cells. The image is representative of eight independent experiments. h Expression of β-catenin (left), c-MYC and cyclin D1 (right) and glyceraldehyde 3-phosphate dehydrogenase (GAPDH) or vinculin, respectively, in lysates of THP1 WT versus THP1 CaSR OE cells. The image is representative of nine independent experiments. Source data are provided as a Source Data file.

