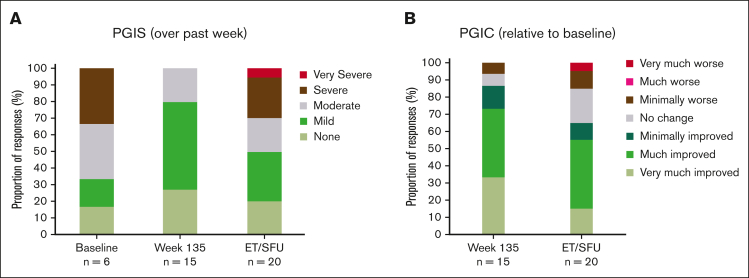
Figure 4.
Change from baseline in PGIS and PGIC questionnaires at week 135 and ET/SFU of CARDINAL. (A) Proportion of responders (%) reporting no, mild, moderate, severe or very severe fatigue at baseline, week 135 and ET/SFU. (B) Proportion of responders (%) reporting degrees of improvement from baseline, from very much improved to very much worse, at week 135 and ET/SFU.

