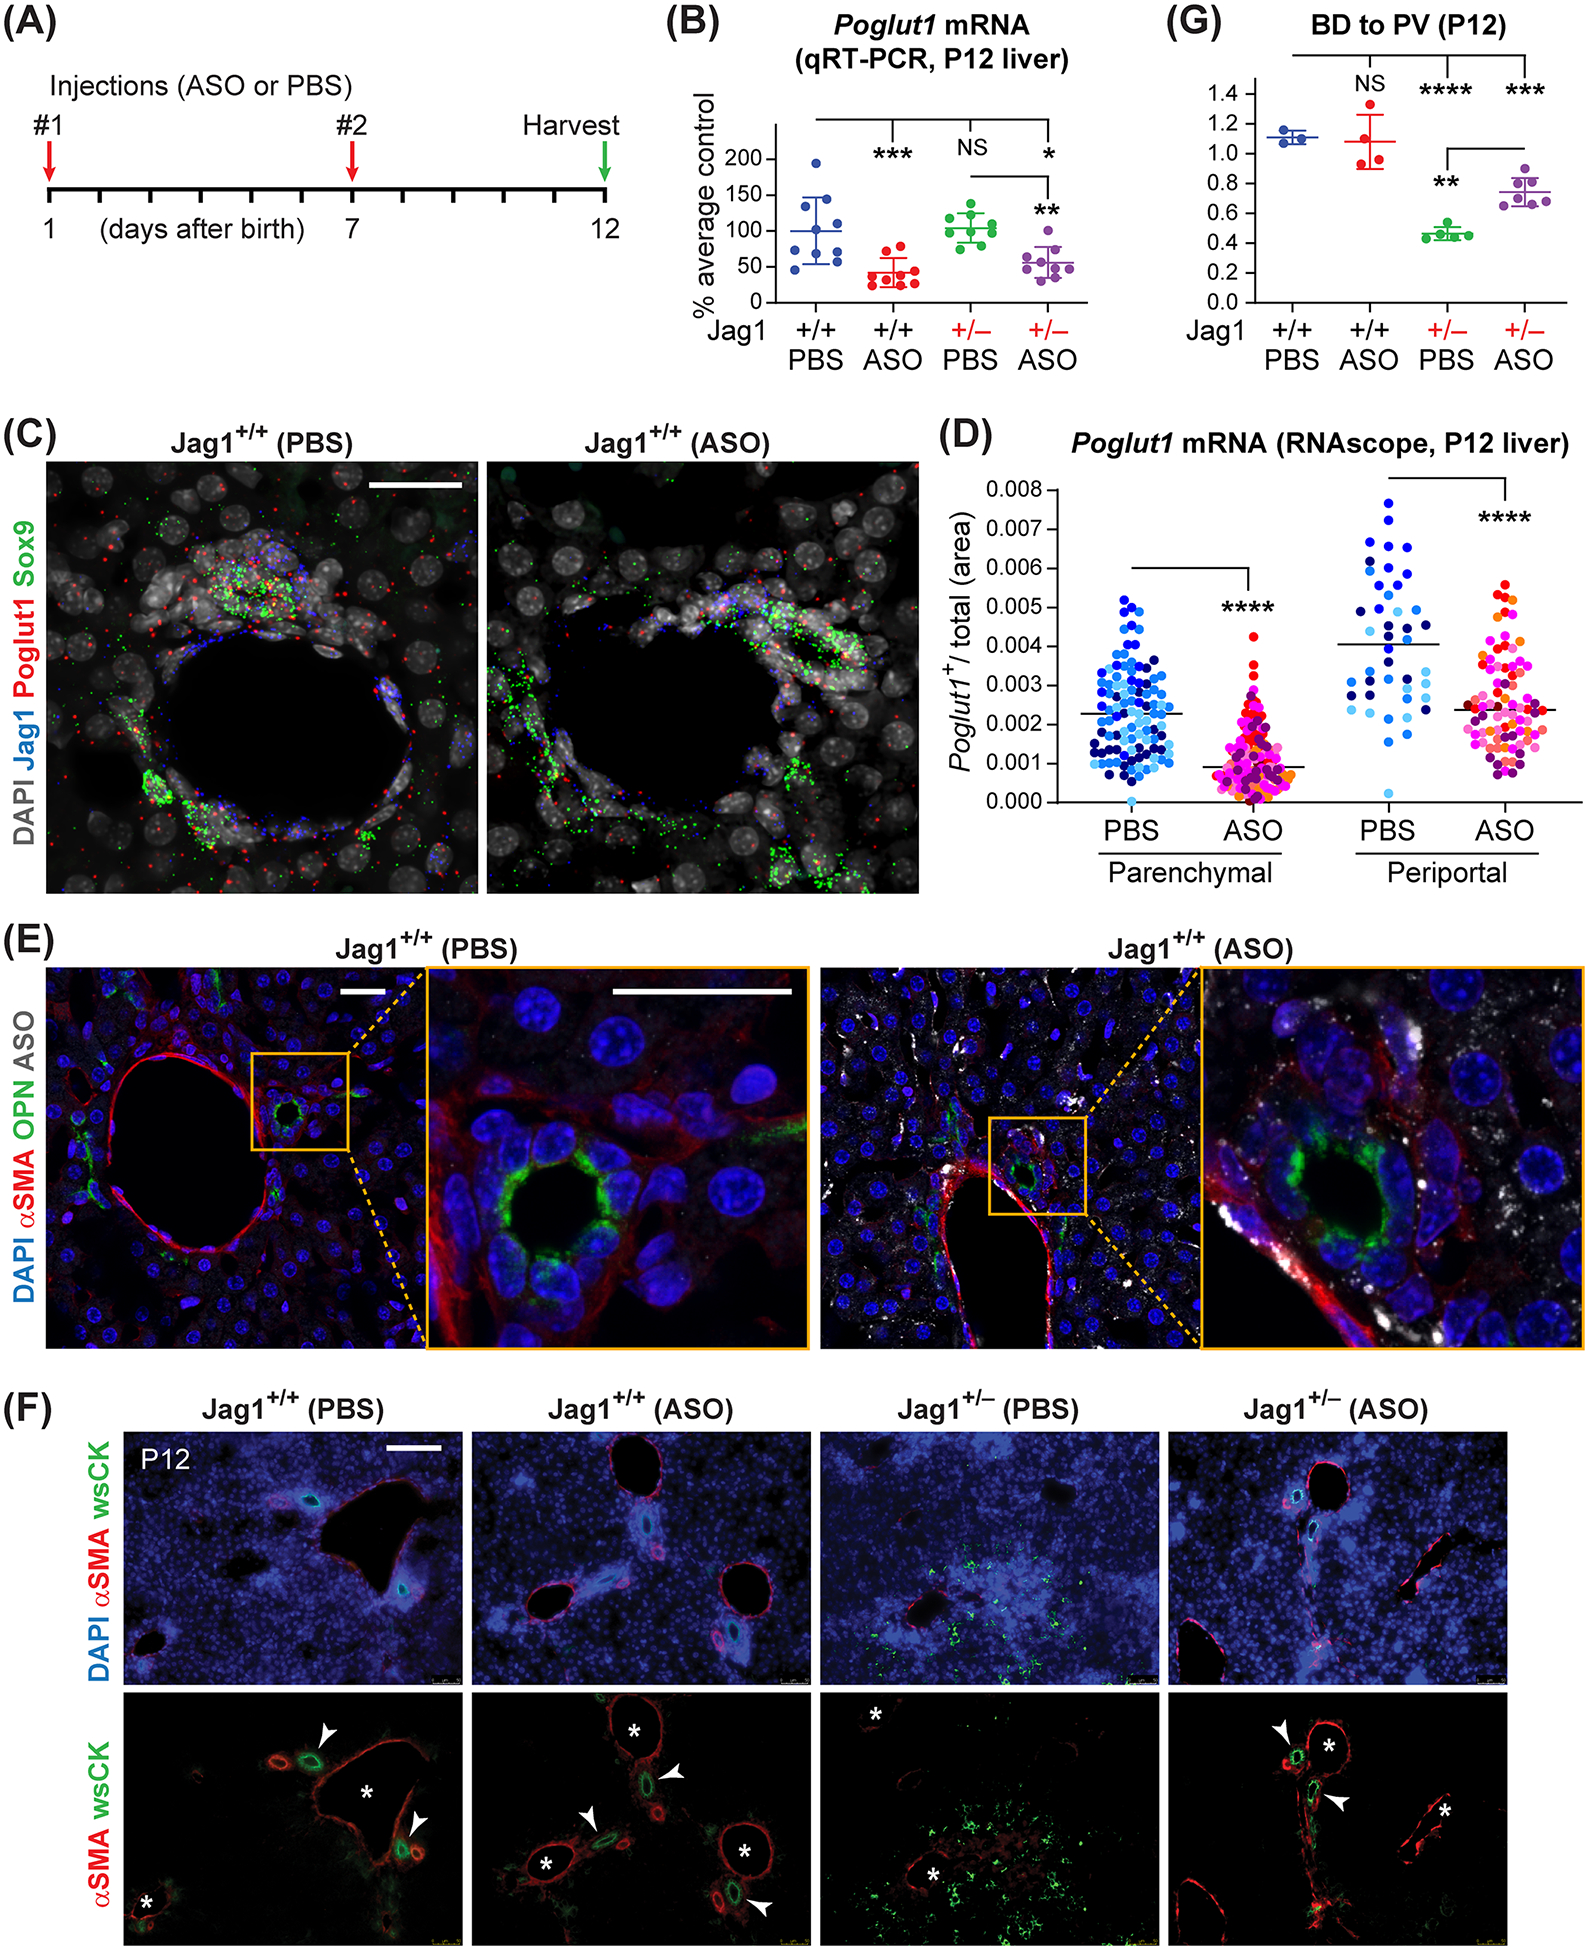
Fig. 1. Early postnatal injection of ASO-1 broadly knocks down Poglut1 in the liver and partially rescues the biliary abnormalities in P12 Jag1+/− animals.

(A) Injection regimen of ASO-1 and PBS in Jag1+/− and WT animals (50 mg/kg/dose). (B) qRT-PCR assays for Poglut1 mRNA levels on WT and Jag1+/− P12 livers injected with ASO or PBS. (C) Liver RNAscope images from ASO- or PBS-injected P12 WT animals, labeled with DAPI and probes for Poglut1, Sox9, and Jag1. (D) Quantification of relative Poglut1+ area of RNAscope images in parenchymal and periportal regions. (E) Liver sections from ASO- or PBS-injected P12 WT animals, stained with antibodies against ASO, osteopontin (OPN) and αSMA. (F) P12 liver sections of each genotype stained with αSMA, wide-spectrum cytokeratin (wsCK) and DAPI. Asterisks mark PVs, arrowheads mark patent BDs. Note the weak αSMA staining, ductular reactions and hypercellularity in the parenchyma of PBS-injected Jag1+/− livers and their rescue upon ASO injections. (G) Average BD to PV ratio in P12 WT and Jag1+/− mice injected with PBS or ASO. In B and G, each circle represents an animal and horizontal lines show mean ± Standard Deviation (SD). In D, circles of the same color represent data from different parenchymal or periportal regions of liver sections from the same animal (n=4 for PBS-injected, n=7 for ASO-injected). NS: not significant, *P<0.05, **P<0.01, ***P<0.001, ****P<0.0001, using one-way ANOVA with Tukey’s multiple comparisons test (B, G) or unpaired t-test with Welch’s correction (D). Scale bars are 25 μm in C, E, and 100 μm in F.
