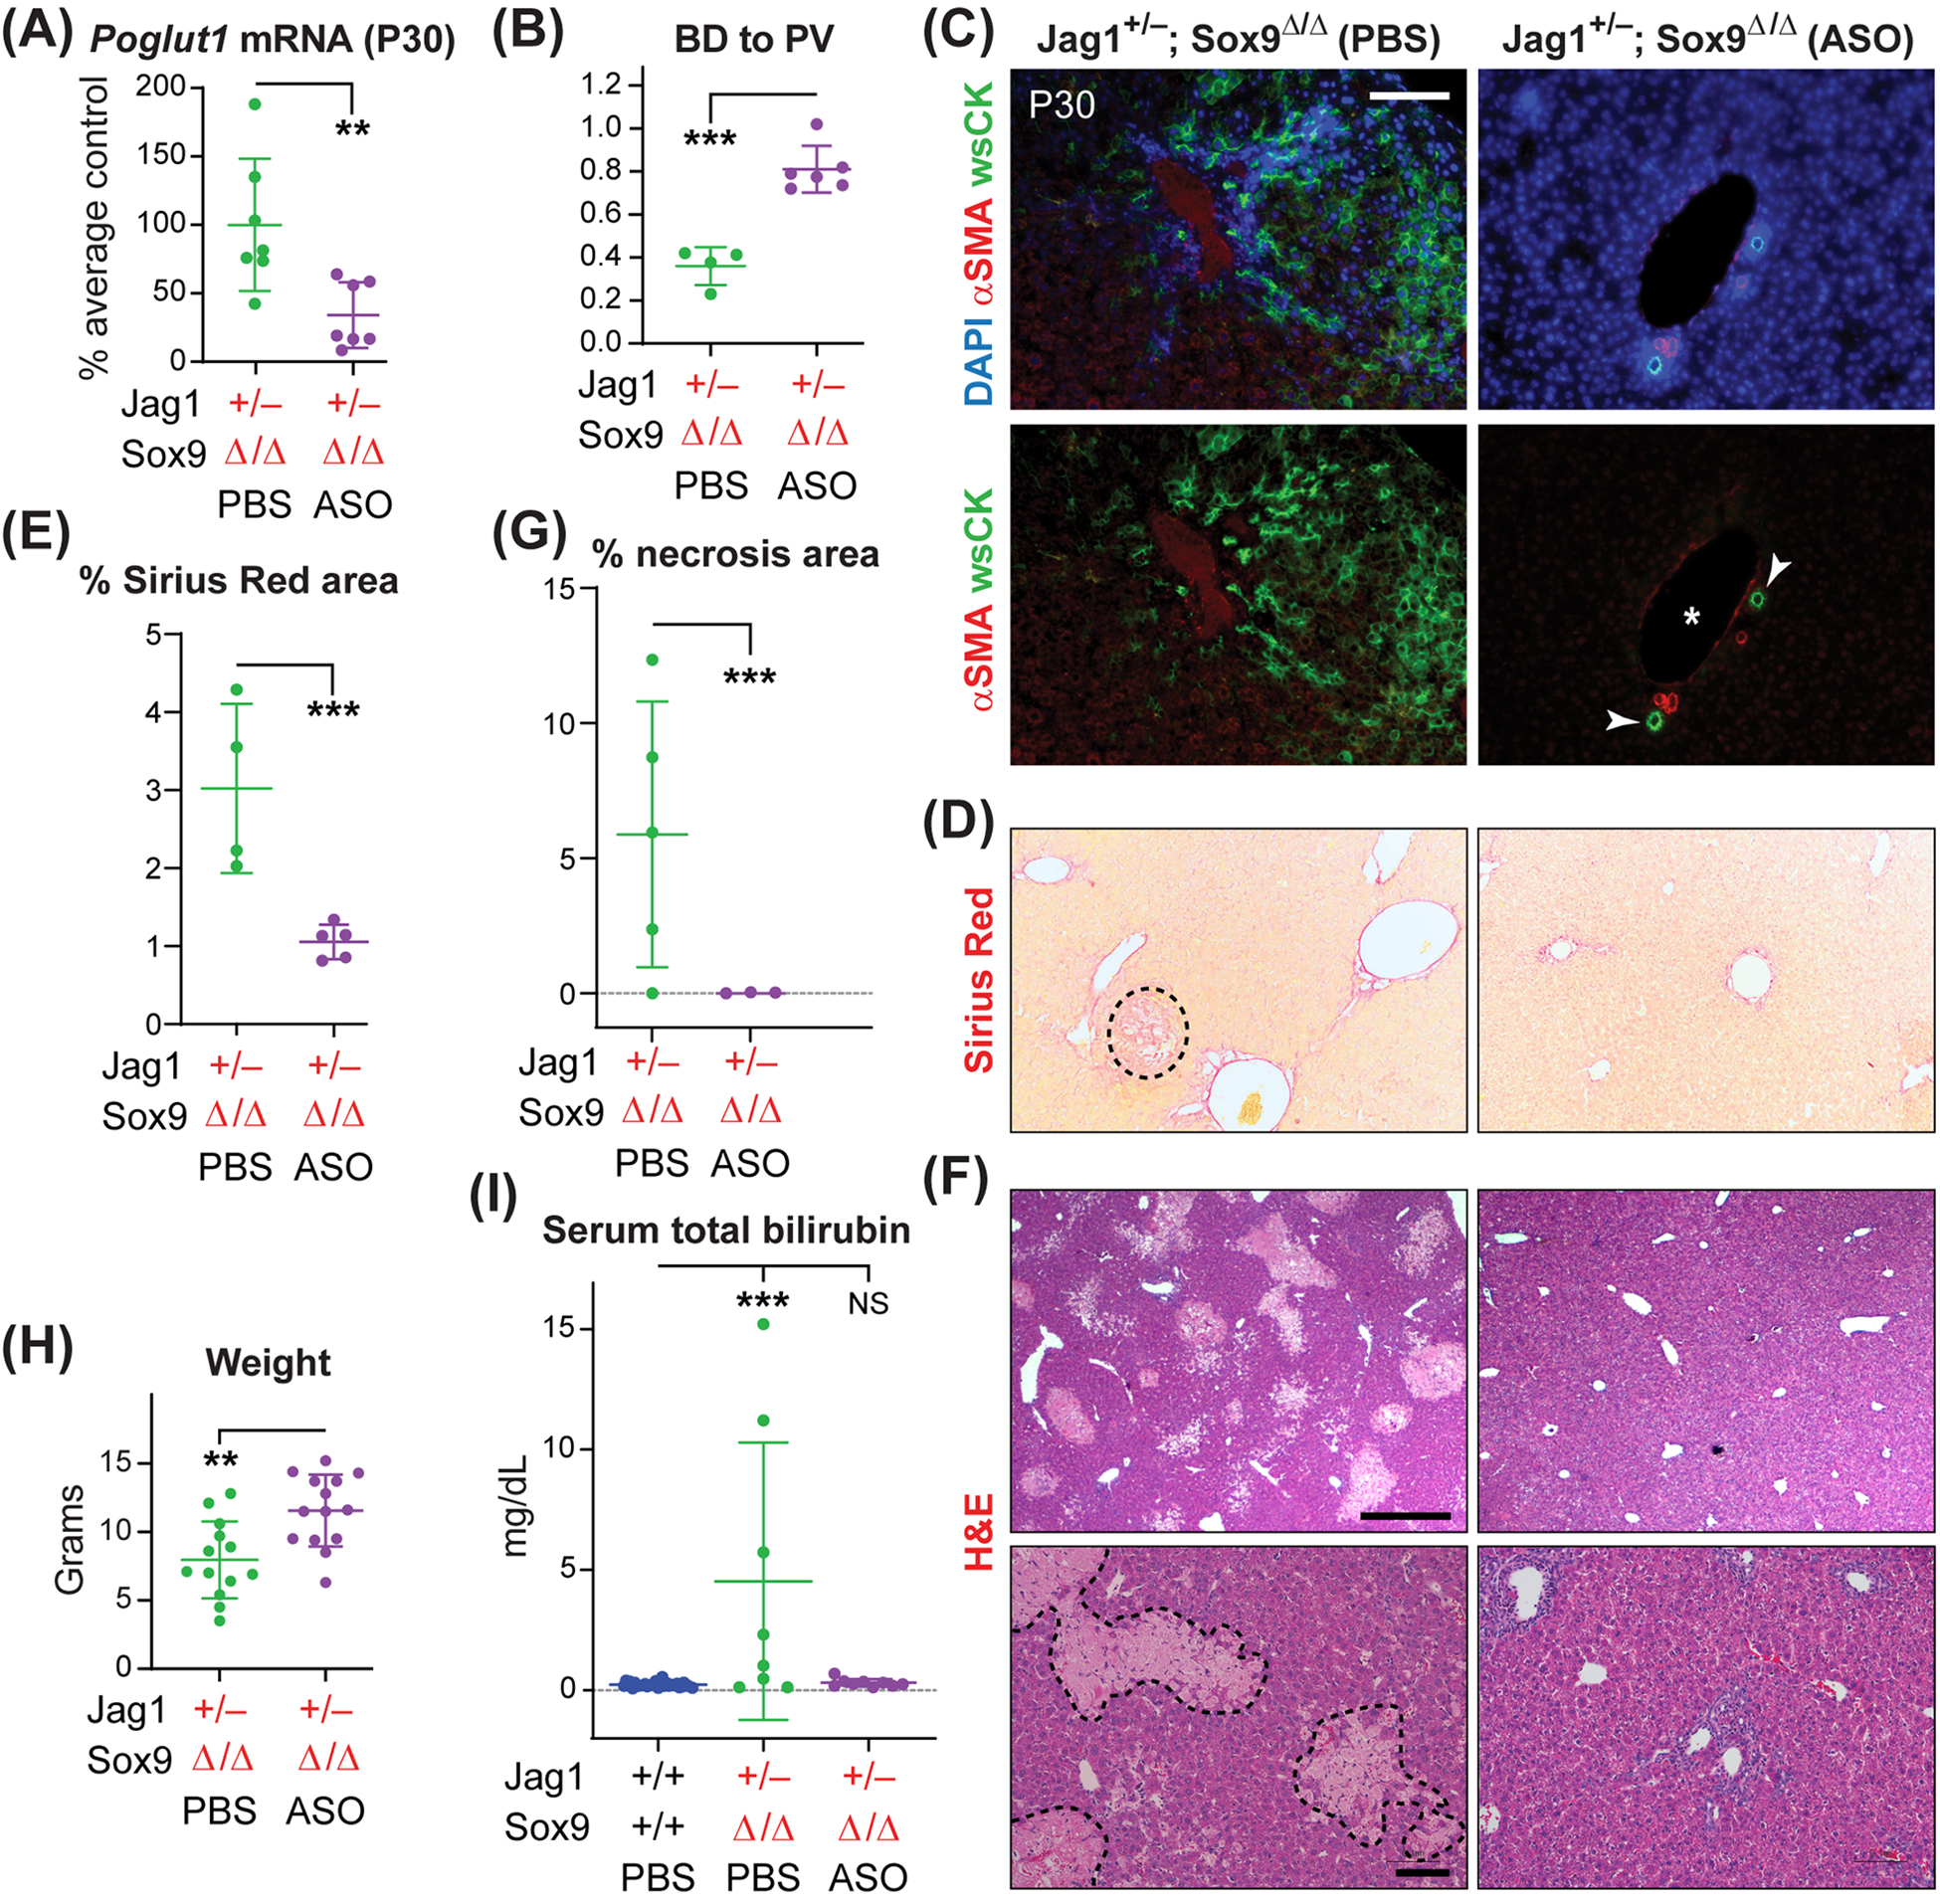
Fig. 4. ASO-1 injections improve the liver phenotypes in Jag1+/− animals lacking both copies of Sox9 in the liver.

(A) qRT-PCR assays for Poglut1 mRNA levels on Jag1+/−;Sox9Δ/Δ P30 livers injected with ASO or PBS. (B) Average BD to PV ratio in Jag1+/−;Sox9Δ/Δ mice injected with PBS or ASO. (C) P30 liver sections of each genotype stained with αSMA, wide-spectrum cytokeratin (wsCK) and DAPI. Asterisks mark PVs, arrowheads mark patent BDs. Scale bar is 100 μm. (D) Sirius Red staining of P30 livers from Jag1+/−;Sox9Δ/Δ animals injected with ASO or PBS. The dashed shape marks a necrotic region. (E) The degrees of liver fibrosis in the indicated genotypes are measured as the percent area of each liver stained with Sirius Red. (F) H&E staining of P30 liver sections from Jag1+/−;Sox9Δ/Δ animals injected with ASO or PBS. Dashed shapes in the lower-left panel mark areas of necrosis. Scale bars are 500 μm (top panels) and 100 μm (bottom panels). Note that some degree of periportal inflammation persists in ASO-injected livers. (G) Percent area of necrotic regions in H&E staining of liver sections form the indicated genotypes. (H) Weights for P30 Jag1+/−;Sox9Δ/Δ animals injected with ASO or PBS. (I) Serum total bilirubin for the indicated genotypes. In all graphs, each circle represents an animal and horizontal lines show mean ± SD. NS: not significant, **P<0.01, ***P<0.001, using one-way ANOVA with Tukey’s multiple comparisons test (I) or unpaired t-test (A, B, E, G, H).
