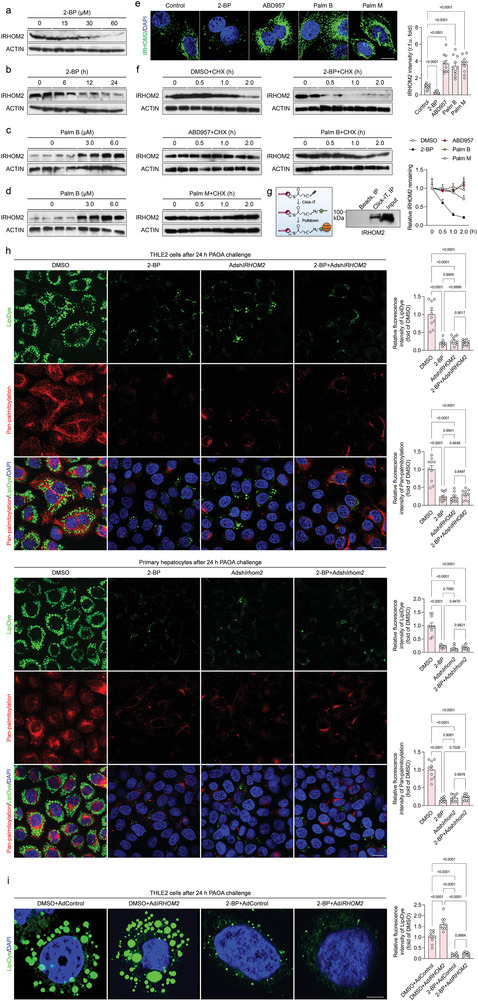
Figure 1.

Identification of palmitoylated‐modificated IRHOM2 in hepatocytes. a) Human hepatocyte THLE2 cells were incubated with a gradually increasing dose of 2‐bromopalmitate (2‐BP) for 24 h, and subjected to immunoblotting detection with IRHOM2 and ACTIN antibodies (n = 4 per group). b) THLE2 cells were treated with 60 µM 2‐BP for 0, 6, 12, and 24 h and then subjected to immunoblotting assay with IRHOM2 and ACTIN antibodies (n = 4 per group). c, d) THLE2 cells (c) and primary human hepatocyte, PHH (d) were incubated with 0, 3, or 6 µM palmostatin B (Palm B), an inhibitor of depalmitoylase enzymes, for 24 h, and subjected to immunoblotting analysis with IRHOM2 and ACTIN antibodies (n = 4 per group). e) THLE2 cells were treated with 60 µM 2‐BP, 1 µM ABD957, 6 µM Palm B, and 10 µM palmostatin M (Palm M) for 24 h, respectively. Left, the fixed sections were subjected to immunofluorescent staining with IRHOM2 (green) and DAPI (blue). Right, the bar graph shows IRHOM2 fluorescence intensity in the indicated group (n = 10 images per group; P < 0.05 versus Control). Scale bars, 10 µm. f) THLE2 cells were preincubated with DMSO, 2‐BP, ABD957, Palm B, or Palm M as a baseline, then treated with cycloheximide (CHX) in the time‐course frame, respectively. The collected cell lysates were subjected to immunoblotting detection with IRHOM2 and ACTIN antibodies. The right curve graph shows the relative IRHOM2 remaining ratio in the indicated time point (n = 4 per group). g) Sketch map of the Click‐iT assay used for IRHOM2 palmitoylation analysis. THLE2 cells were incubated with 120 µM Click‐iT palmitic acid‐Azides for 8 h, and corresponding collected lysates were subjected to Click‐iT detection in accordance with product instruction, followed by western blotting analysis with IRHOM2 antibody. The right western blotting bands show the IRHOM2 expression in the indicated group. h, Representative images of immunofluorescent staining showing the lipid droplets formation and deposition (LipiDye, green) and universal palmitoylation levels (red) in THLE2 cells (upper) and mouse primary hepatocytes (lower) after transfection with indicated vectors in response to PAOA treatment for 24 h (n = 10 images per group; P < 0.05 versus DMSO). Scale bars, 5 µm. i) Representative images of immunofluorescent staining showing the lipid droplets formation and accumulation (LipiDye, green) in AdIRHOM2‐ or 2‐BP‐treated THLE2 cells after 24 h PAOA challenge (n = 10 images per group; P < 0.05 versus DMSO). Scale bars, 10 µm. Data are expressed as mean ± SEM. The relevant experiments presented in this part were performed independently at least three times. Significance is determined by one‐way analysis of variance (ANOVA) followed by Dunnett's multiple comparisons test analysis (e, h, i). The P‐value < 0.05 was considered as significant difference.
