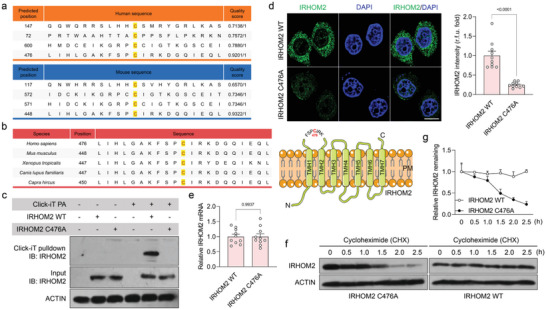
Figure 2.

Identification of the palmitoylation site on IRHOM2 at evolutionarily conserved cysteine residues. a) Predicted position of palmitoylation site on IRHOM2 in Homo sapiens (upper) and Mus musculus (lower) using GPS‐Palm software (MacOS_20 200 219) (The CUCKOO Workgroup, http://gpspalm.biocuckoo.cn/), and MDD‐Palm algorithm (http://csb.cse.yzu.edu.tw/MDDPalm/). b) Left, palmitoylation site of IRHOM2 with conserved cysteine residues in Homo sapiens, Mus musculus, Xenopus tropicalis, Canis lupus familiaris, and Capra hircus. Right, schematic diagram showing the IRHOM2 wild‐type (WT) structure of Homo sapiens and possible palmitoylation site. c) THLE2 cells with IRHOM2 WT or IRHOM2 C476A mutant overexpression were incubated with Click‐iT palmitic acid‐Azides for 8 h, and corresponding collected lysates were subjected to Click‐iT detection in accordance with product instruction. The palmitoylated proteins were placed onto the pull‐down detection by streptavidin‐sepharose bead conjugate, followed by western blotting analysis with IRHOM2 and ACTIN antibodies. The palmitoylation of IRHOM2 WT was observed in top gel, lane 5, but not for the IRHOM2 C476A in top gel, lane 6, or control groups. This experiment was repeated 3 times independently. d) THLE2 cells were overexpressed with IRHOM2 WT or IRHOM2 C476A mutant, respectively. Left, the fixed sections were subjected to immunofluorescent staining with IRHOM2 (green) and DAPI (blue). Right, the bar graph shows IRHOM2 fluorescence intensity in the indicated group (n = 10 images per group; P < 0.05 versus IRHOM2 WT). Scale bars, 10 µm. e) qPCR analysis showing the IRHOM2 mRNA levels in IRHOM2 WT or IRHOM2 C476A mutant (n = 10 per group; P < 0.05 versus IRHOM2 WT). f, g) THLE2 cells with IRHOM2 WT or IRHOM2 C476A mutant overexpression were incubated with CHX in a time‐course frame, respectively. The collected cell lysates were subjected to immunoblotting detection with IRHOM2 and ACTIN antibodies (f). The curve graph (g) shows the relative IRHOM2 remaining ratio in the indicated time point (n = 4 per group). Data are expressed as mean ± SEM. The relevant experiments presented in this part were performed independently at least three times. Significance determined by 2‐sided Student's t‐test (d, e). The P‐value < 0.05 was considered as significant difference.
