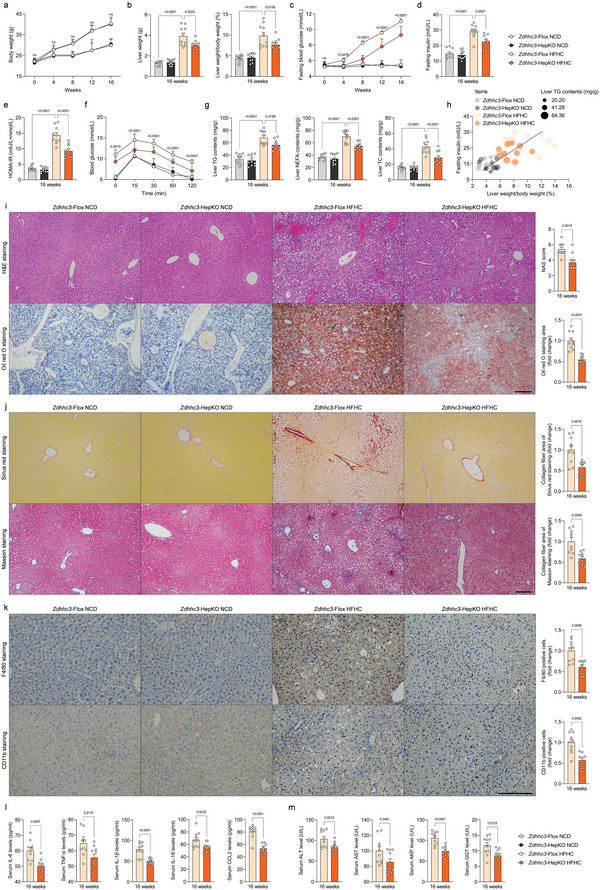
Figure 5.

Hepatocyte‐specific loss of Zdhhc3 protects against HFHC‐induced NASH pathogenesis. a‐g) Records for the body weight (a), liver weight and the ratio of liver weight/body weight (%) (LW/BW) (b), fasting blood glucose levels (c), fasting insulin levels (d), HOMA‐IR index (e), glucose tolerance test (GTT) (f) and liver TG, NEFA and TC contents (g) of the HFHC‐fed Zdhhc3‐Flox mice and Zdhhc3‐HepKO mice; NCD diet‐fed mice were treated as corresponding control (n = 10 mice per group; P < 0.05 versus Zdhhc3‐Flox HFHC group). h) Pearson analysis indicating the correlations between fasting insulin, ratio of liver weight/body weight (%), and liver TG contents in indicated groups (n = 10 per parameter; P < 0.001 for all of these correlations). i‐k) Representative pictures of H&E staining, oil red O staining, histological NAS score (i) changes, sirius red staining, masson staining (j), and F4/80 and CD11b positive cells expression (k) in indicated groups (magnification, 100× for H&E staining, oil red O staining, masson staining and sirius red staining; magnification, 200× for F4/80 and CD11b staining; n = 10 images per group; P < 0.05 versus Zdhhc3‐Flox HFHC group). l, Records for inflammation‐related cytokines profiles including IL‐6, TNF‐α, IL‐1β, IL‐18 and CCL2 in serum from HFHC‐fed HepKO or Flox mice (n = 10 mice per group; P < 0.05 versus Zdhhc3‐Flox HFHC group). m, Records for liver function‐related indicators including ALT, AST, AKP, and GGT in serum from HFHC‐fed HepKO or Flox mice (n = 10 mice per group; P < 0.05 versus Zdhhc3‐Flox HFHC group). Data are expressed as mean ± SEM. The relevant experiments presented in this part were performed independently at least three times. Significance is determined by two‐way analysis of variance (ANOVA) followed by multiple comparisons test analysis (a‐g) or 2‐sided Student's t‐test (i‐m). The P‐value < 0.05 was considered as significant difference.
