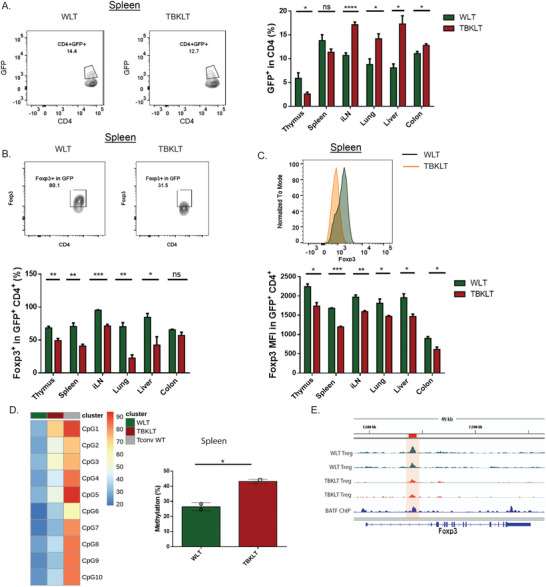
Figure 6.

Treg stability and FOXP3 expression require BATF function in Tregs. A) Frequency of GFP+ Tregs in thymus, spleen, iLN, lungs, liver, and colon of TBKLT and WLT control mice aged 10–12 weeks. B,C) Similar to A, but showing frequency of FOXP3+ cells in GFP+ Tregs and MFI of FOXP3. D) Heatmap and bar plot showing percentage of methylation at the CNS2 region of the Foxp3 locus in sorted GFP+ Tregs from spleens of WLT and TBKLT mice at 7 weeks of age. WT CD4 T cells (Tconv WT) were used as a negative control. E) Representative tracks of ATAC‐seq data and published BATF ChIP‐seq data in Tregs showing binding of BATF at the CNS2 region of the Foxp3 locus. Data in B–D are pooled from two independent experiments with 1–2 mice per group. Data here are shown ± SEM. *p < 0.05, ** p < 0.01, and *** p < 0.001 (two tailed unpaired t‐test).
