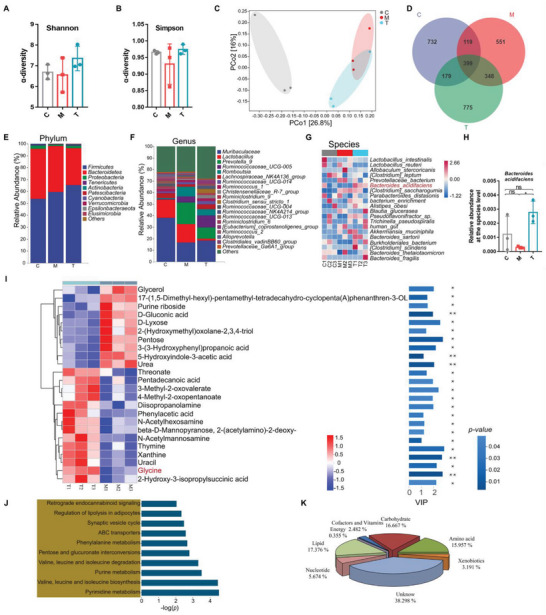
Figure 4.

CGA increased gut B. acidifaciens abundance and glycine levels in PI‐IBS rats. A,B) Observed α‐diversity (Shannon and Simpson index) in control rats (C), PI‐IBS rats (M) and CGA‐rectal administration PI‐IBS rats (T) (n = 3). C) Observed β‐diversity (PCoA) among the three groups (n = 3). D) Scalar‐Venn representation among the three groups (n = 3). E–G) Relative abundance of the identified fecal microbiota at the (E) phylum, (F) genus, and (G) species levels as per 16S rRNA gene sequencing (n = 3). H) The relative abundance of B. acidifaciens. I) Hierarchical clustering of heatmaps of 24 significantly changed metabolites in PI‐IBS rats and CGA‐treated rats (n = 3). Each row in the heatmap represents a particular metabolite, and each column represents a sample. The levels of metabolites vary with color, and the relationship between color gradient and value is shown in the gradient color block. Red and blue indicate increased and decreased levels of metabolites, respectively. The metabolite cluster tree is shown on the left. Importance of metabolite variables in projection value (VIP) is shown on the right, with larger values indicating greater differences in metabolite composition between the two groups. The color of the bars indicates a statistically significant (p value) difference in metabolite levels between the two groups, and the smaller the p value, the darker the color. Glycine is labeled in red (n = 3). J) KEGG pathway enrichment analysis of the significantly altered metabolites; the name of each KEGG pathway is shown on the left, and the corresponding p value is shown on the right (n = 3). K) Metabolite functional classification. Each color in the pie chart represents a different classification, and its area represents the relative proportion of the metabolites (n = 3). C, control group; M, PI‐IBS rat group; T, PI‐IBS rats rectally administered CGA group. Data are presented as the mean ± SD. ns, p > 0.05; * p < 0.05; ** p < 0.01.
