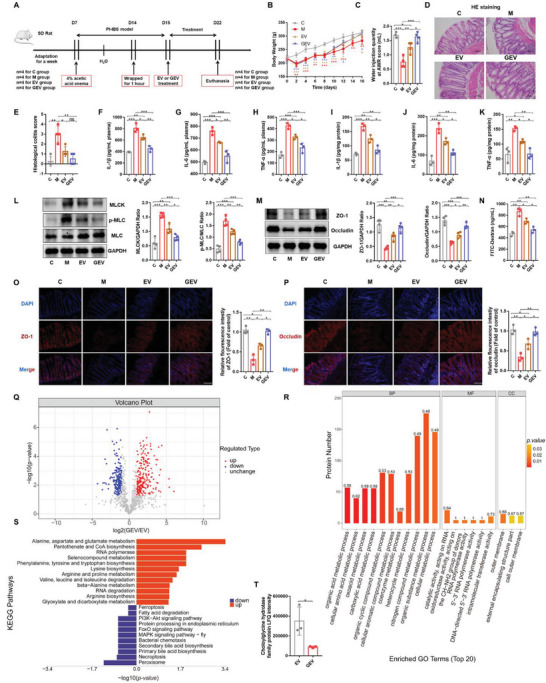
Figure 6.

Glycine ameliorates PI‐IBS symptoms in rats by altering the protein profile of B. acidifaciens EVs. A) Experimental scheme of rectal administration of EVs in PI‐IBS rats (n = 4). B) Changes in body weight following EV treatment (n = 4). C) Water injection rate when the AWR score was 3 following treatments with EVs (n = 4). D,E) H&E staining and pathological score of colon sections (n = 4). F–K) Concentrations of the representative proinflammatory cytokines IL‐1β, IL‐6, and TNF‐α in rat serum samples and colon tissue (n = 3). L) Expression of key proteins of the MLCK/p‐MLC signaling pathway in rat colon tissue (n = 4). M) The expression of TJ proteins (ZO‐1, Occludin) in rat colon tissue (n = 4). N) Measurement of gut permeability in rats (n = 3). O,P) Immunofluorescence staining of TJ protein (ZO‐1, Occludin) expression in the colonic section (n = 3). Q) Volcano plot showing the number of proteins differentially expressed between GEVs and EVs, with a cutoff of p <0.05 and |fold change| >2. R) GO classification (biological process, molecular function, and cellular components) of all differentially expressed proteins in glycine‐induced B. acidifaciens EVs and the top 20 enriched GO terms. S) KEGG pathway enrichment analysis of the differentially expressed proteins in GEVs compared to their expression in EVs. T) Choloylglycine hydrolase family protein LFQ intensity (n = 3). C, control group; M, PI‐IBS rat group; EV, PI‐IBS rats rectally administered EV group; GEV, PI‐IBS rats rectally administered GEV group. Scale bar, 100 µm. Data are presented as the mean ± SD. ns, p > 0.05; * p < 0.05; ** p < 0.01; ***; p < 0.001.
