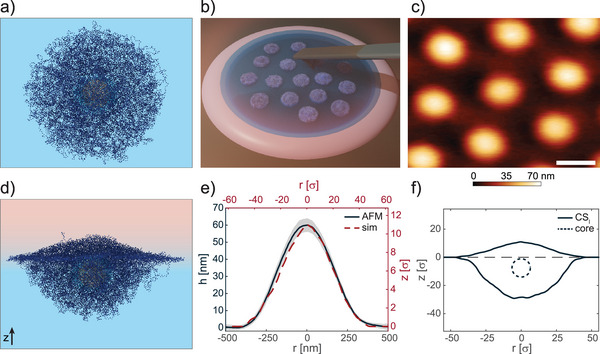
Figure 1.

Core‐shell microgels at a fluid interface. a) Simulation snapshot of a core‐shell microgel in bulk water. For visual clarity, the size of shell and chains beads is smaller than that used in simulations. The microgel has a relatively large shell (CS l ), similar to the C A S 346 experimental case. b) Sketch of the setup used for in situ AFM imaging of microgels adsorbed at the hexadecane‐water interface. c) AFM height image of a monolayer of C A S 346 captured from the oil side. Scale bar: 500 nm. d) Simulation snapshot of a CS l core‐shell microgel after adsorption at an oil‐water interface. e) Black line: mean height profile of microgels as in c), the shaded region indicates the standard deviation of the height profiles averaged on the basis of at least ten particles. Red dashed line: simulated height profile of the polymer protrusion in the oil phase for CS l microgel. f) Simulated core‐shell profile (solid line) and core position (dotted line) for CS l microgel. Positive z‐values indicate the oil phase.
