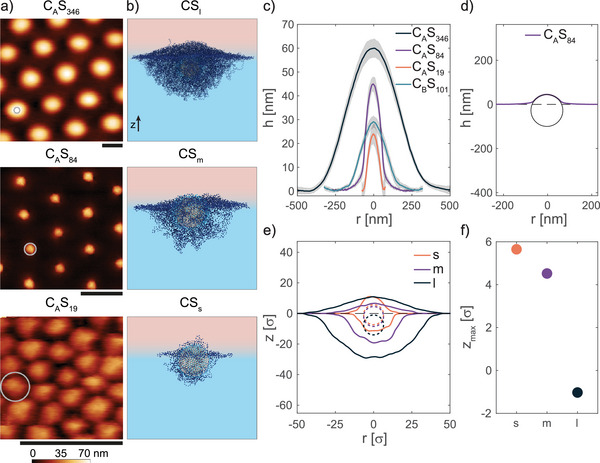
Figure 2.

Influence of the shell thickness on the conformation of core‐shell microgels at a fluid interface. a) AFM height images of microgel monolayers captured from the hexadecane side. The gray circle represents the core size. Scale bars: 500 nm. b) Simulation snapshots of core‐shell microgels adsorbed at an oil‐water interface for different shell thicknesses. c) Mean height profiles of microgels as in a). The corresponding AFM image for C B S 101 is reported in Figure S4 (Supporting Information). The shaded regions indicate the standard deviation of the height profiles calculated on at least ten particles. d) Fit with a circle of the central portion of the height profile of C A S 84 microgel. The fitted radius is R = 72.3 nm. e) Height profiles of in silico core‐shell microgels (solid line) and core position (dotted line). Positive z‐values indicate the oil phase. f) Protrusion height of the core with respect to the interfacial plane corresponding to z = 0 for the three in silico core‐shell microgels.
