
Figure 4.
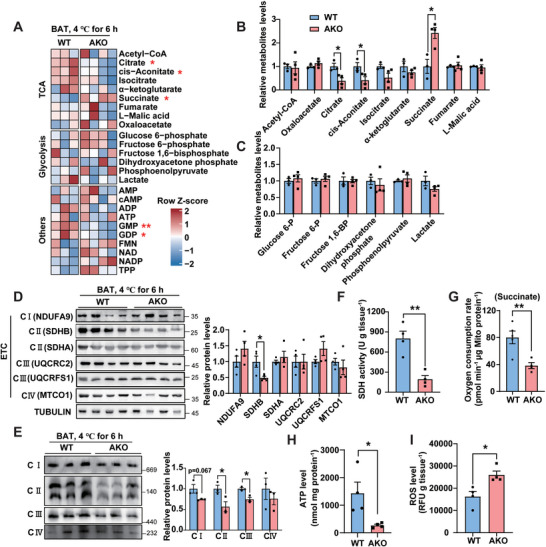
IFI27 ablation elicits succinate accumulation in BAT due to a decrease in SDHB level. A) Heat map of metabolomics analysis in BAT. Mice were challenged at 4 °C for 6 h. n = 3–4 each genotype, 12‐week‐old female mice. B) The relative level of TCA metabolites in BAT measured by LC‐MS/MS assay. n = 3–4 each genotype. C) The relative level of glycolysis‐related metabolites in BAT measured by LC‐MS/MS assay. n = 3–4 each genotype. D) Western blot analysis of ETC‐related proteins and their quantification in BAT of mice after 6 h cold exposure. n = 4 each genotype. E) Mice were treated as in (A). BAT mitochondria were isolated and underwent blue native‐PAGE analysis. Right panel showed the quantification of respiratory complexes. n = 3 each genotype. F–I) Mice were treated as in (A). SDH activity (F), mitochondrial oxygen consumption rate with succinate as substrates (G), ATP (H) and ROS (I) levels were determined in BAT. n = 4–5 each genotype. For statistical analyses, unpaired two‐tailed Student's t‐tests were performed. The data shown are mean ± SEM. *p < 0.05; **p < 0.01.