
Figure 7.
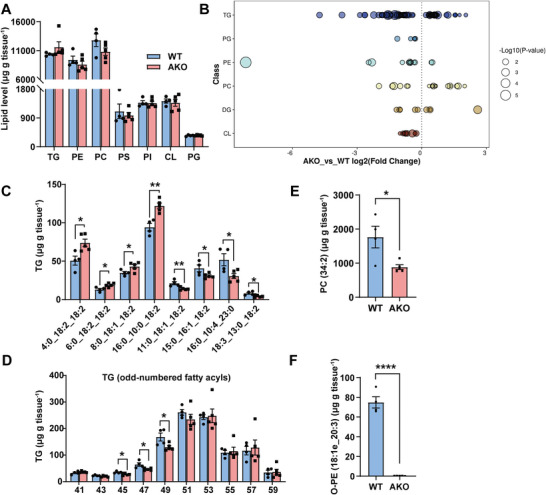
The alteration in molecular species of lipids in the AKO mice BAT. A) Lipidomic analysis of BAT isolated from WT and AKO mice raised at 22 °C. The overall amount of triglycerides and phospholipids was quantified as µg g−1 tissue. WT n = 4, AKO n = 5. TG: triglyceride; PE: phosphatidylethanolamine; PC: phosphatidylcholine; PS: phosphatidylserine; PI: phosphatidylinositol; CL: cardiolipin; PG: phosphatidylglycerol. B) Log2 fold changes in lipid species (AKO versus WT mice, p < 0.05). DG: diglyceride. C) The content of the indicated triglyceride species in BAT of WT (n = 4) and AKO (n = 5) mice. D) The content of the major triglyceride species with odd‐numbered acyl chains. WT n = 4, AKO n = 5. E) The content of the individual PC (34:2) in BAT of WT (n = 4) and AKO (n = 5) mice. F) The content of the individual ether PE (18:1e_20:3) in BAT of WT (n = 4) and AKO (n = 5) mice. For statistical analyses, unpaired two‐tailed Student's t‐tests were performed. The data shown are mean ± SEM. *p < 0.05; **p < 0.01; ****p < 0.0001.