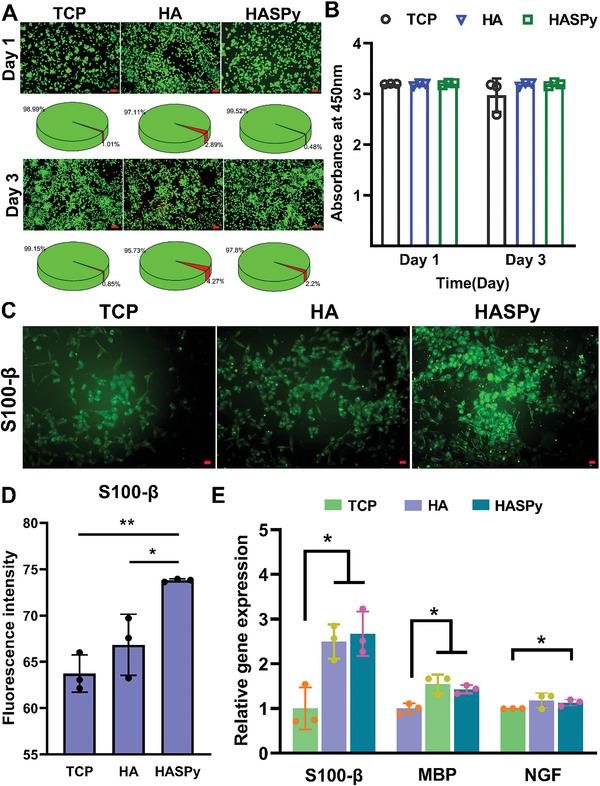
Figure 5.

Expression and functional verification of related genes and proteins in Schwann cells on the hydrogel. A) Live/Dead staining and survival rate of Schwann cells cultured on TCP (tissue culture plate), HA, and HASPy hydrogel. Scale bar: 100 µm. B) Cell Counting Kit‐8 (CCK‐8) assay (*p < 0.05, **p < 0.01, n = 3). C) Immunofluorescence images of Schwann cells after 3 days of growth in TCP, HA, and HASPy groups. Scale bar: 50 µm. D) Fluorescence intensity of S100‐β (*p < 0.05, **p < 0.01, n = 3). E) Gene expression of S100‐β, MBP, NGF by qRT‐PCR test (*p < 0.05, **p < 0.01, n = 3).
