
Figure 6.
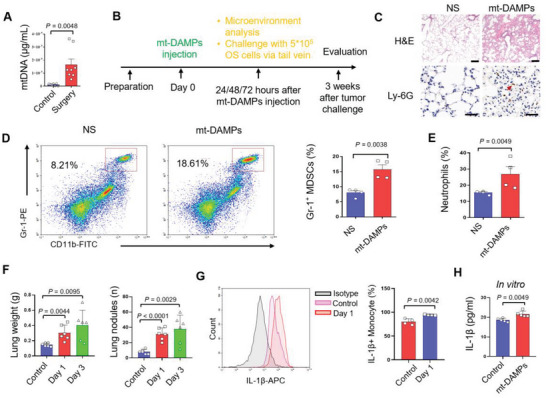
mt‐DAMPs initiated the postoperative inflammation and Gr‐1+ myeloid cells infiltration in lung. A) The quantitative analysis of the circulating mtDNA in mice subject to surgery (n = 8). B) The experimental design of mt‐DAMPs injection (mtDNA 5 µg) to mimic the postoperative mt‐DAMPs releasing. C) H&E staining and immunohistochemistry staining of Ly‐6G in lung from mice with mt‐DAMPs injection and without mt‐DAMPs injection (Scale bars, 50 µm for H&E, 100 µm for Ly‐6G IHC image). D) Flowcytometry reflecting the CD11b+Gr‐1+ MDSCs in mice with mt‐DAMPs injection and without mt‐DAMPs injection, and statistics of the MDSCs in the lung of mice with mt‐DAMPs injection and without mt‐DAMPs injection (n = 4). E) Statistics of the neutrophil in the lung of mice with mt‐DAMPs injection and without mt‐DAMPs injection (n = 4). F) Statistics of the weight and number of pulmonary metastases in mice who received mt‐DAMPs injection following circulating osteosarcoma cells injection one day and three days after mt‐DAMPs injection (n=6) (5 × 10⁵ cells per mouse). G) Flow cytometry analysis of the IL‐1β+ monocyte and statistics of the amount of IL‐1β+ monocyte in lungs after surgery(n = 4). H) ELISA quantify of the IL‐1β secretion after mt‐DAMPs stimulation on RAW264.7 monocytes (P<0.05). Graphs show mean ± SEM. *P < 0.05; **P < 0.01; ***P < 0.001. ns, not significant.