Figure 1.

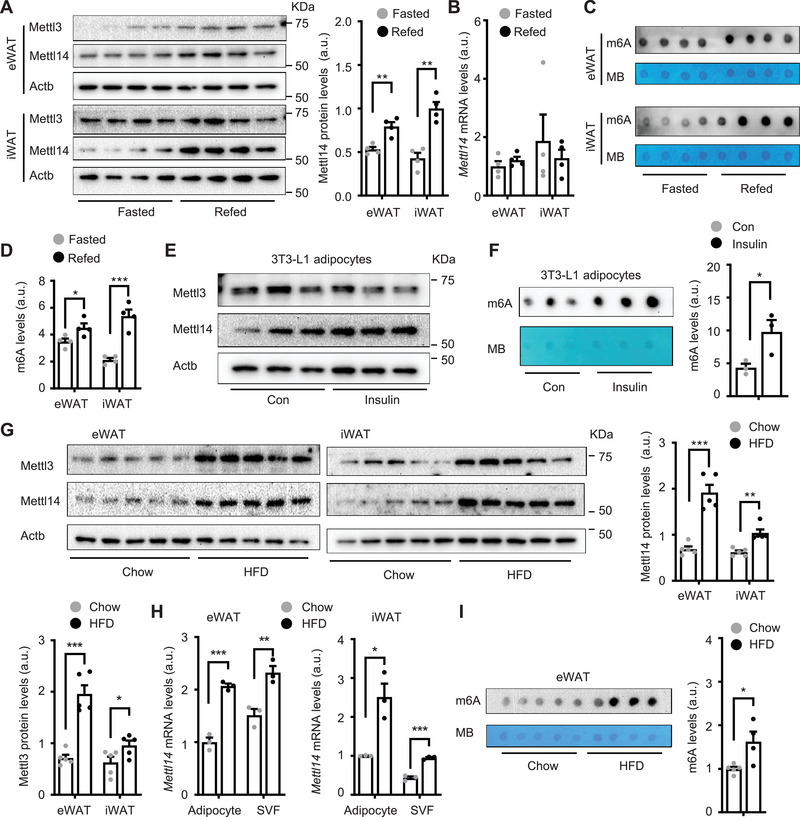
Mettl3/Mettl14/m6A‐based RNA modification is upregulated in fat by insulin and feeding and in obesity. A–D) C57BL/6J male mice (8 weeks old) were fasted overnight and then refed for 3 h. White adipose tissue (WAT) was harvested. A) epididymal WAT (eWAT) and inguinal WAT (iWAT) extracts were immunoblotted with the indicated antibodies. Mettl14 levels were normalized to Actb levels (n = 4 mice per group). a.u.: arbitrary unit. B) Mettl14 mRNA levels were measured by qPCR and normalized to 36B4 levels (n = 4 mice per group). C,D) Total m6A and total RNA levels were measured by dot blot assays and methylene blue (MB) staining. M6A levels were normalized to total RNA levels (n = 4 mice per group). E,F) 3T3‐L1 cells were differentiated into adipocytes. E) Cell extracts were immunoblotted with the indicated antibodies. F) m6A levels were measured by dot blot assays and normalized to total RNA levels (n = 3 repeats per group). G–I) C57BL/6J male mice (8 weeks old) were fed a high fat diet (HFD) for 12 weeks. G) iWAT and eWAT extracts were immunoblotted with the indicated antibodies (overnight fasting). Mettl3 and Mettl14 levels were quantified and normalized to Actb levels (n = 5 mice per group). H) Adipocytes and stromal vascular fraction (SVF) cells were purified from iWAT and eWAT. Mettl14 mRNA abundance was measured by qPCR and normalized to 36B4 levels (n = 3 mice per group). I) m6A levels in eWAT were measured by dot blot assays and normalized to total RNA levels. Chow: n = 5, HFD: n = 4. Data are presented as mean ± SEM. *p < 0.05, **p < 0.01, ***p < 0.001, Student's t test.
