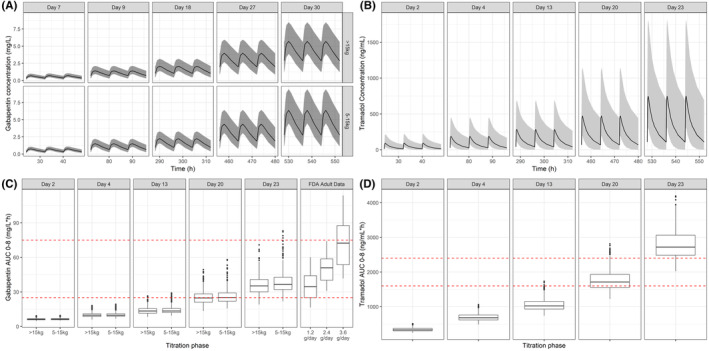
FIGURE 1.

Upper panels: Simulated concentration versus time profiles of gabapentin (A) and tramadol (B) on the last day of each titration step. Data are shown stratified by weight band for gabapentin. Solid line shows the median, shaded area indicates the 95% confidence interval. Lower panels: Whisker‐box plots showing the predicted AUC for gabapentin (C) and predicted AUC for tramadol (D) for each titration step, based on a t.i.d. regimen. Gabapentin results are compared to the observed AUC values after doses of 1.2–3.6 g to adult subjects. Dotted red line shows the putative target exposure range for gabapentin (32.8–75.1 mg/L*h) and tramadol (1600–2400 ng/mL*h). Lower and upper hinges of the box‐plots correspond to the first and third quartiles. The upper whisker extends from the hinge to the highest value that is within 1.5*IQR of the hinge, where IQR is the inter‐quartile range, or distance between the first and third quartiles. The lower whisker extends from the hinge to the lowest value within 1.5*IQR of the hinge. Data beyond the end of the whiskers are outliers and plotted as points. IQR, interquartile range.
