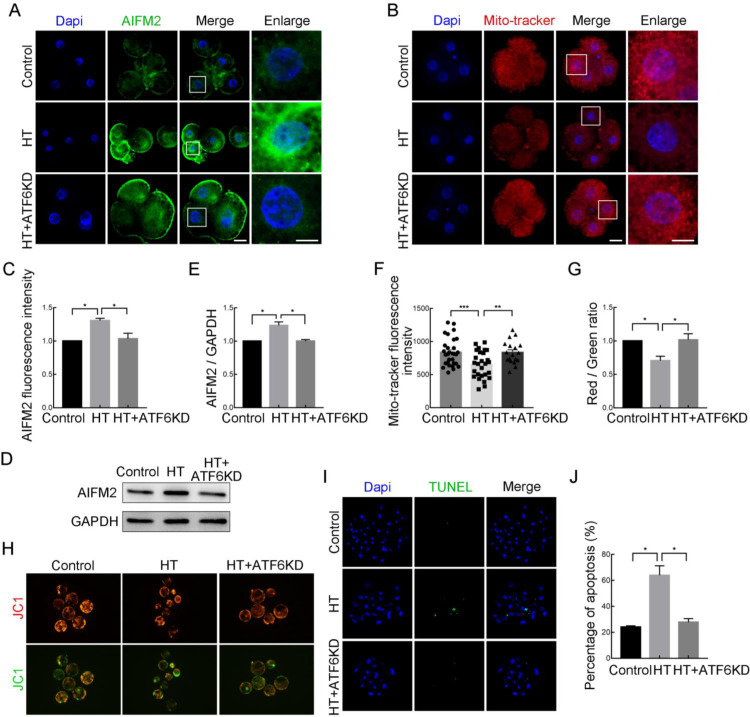
Figure 5.
Effects of ATF6 on mitochondrial function and apoptosis in high-temperature (HT)-embryos
A: Typical images of AIFM2 intensity at 4C stage after HT exposure and ATF6 dsRNA microinjection. Blue, DAPI; Green, AIFM2. Bar: 20 μm. B: Typical images of MitoTracker intensity at 4C stage after HT exposure and ATF6 dsRNA microinjection. Blue, DAPI; Red, MitoTracker. Bar: 20 μm. C: Fluorescence intensity of AIFM2 at 4C stage after HT exposure and ATF6 dsRNA microinjection. *: P<0.05. D: Western blotting results of AIFM2 protein expression after HT exposure and ATF6 dsRNA microinjection. E: Band intensity analysis of AIFM2 after HT exposure and ATF6 dsRNA microinjection at 4C stage. *: P<0.05. F: Fluorescence intensity of MitoTracker at 4C stage after HT exposure and ATF6 dsRNA microinjection. **: P<0.01; ***: P<0.001. G: JC-1 signal (red/green ratio) after HT exposure and ATF6 dsRNA microinjection. *: P<0.05. H: Typical images of JC-1 green and red channels at BL stage after HT exposure and ATF6 dsRNA microinjection. Bar: 100 μm. I: Typical images of TUNEL staining at BL stage after HT exposure and ATF6 dsRNA microinjection. Blue, DAPI; Green, TUNEL. Bar: 20 μm. J: Percentage of apoptosis at BL stage after HT exposure and ATF6 dsRNA microinjection. *: P<0.05.

