Figure 3.
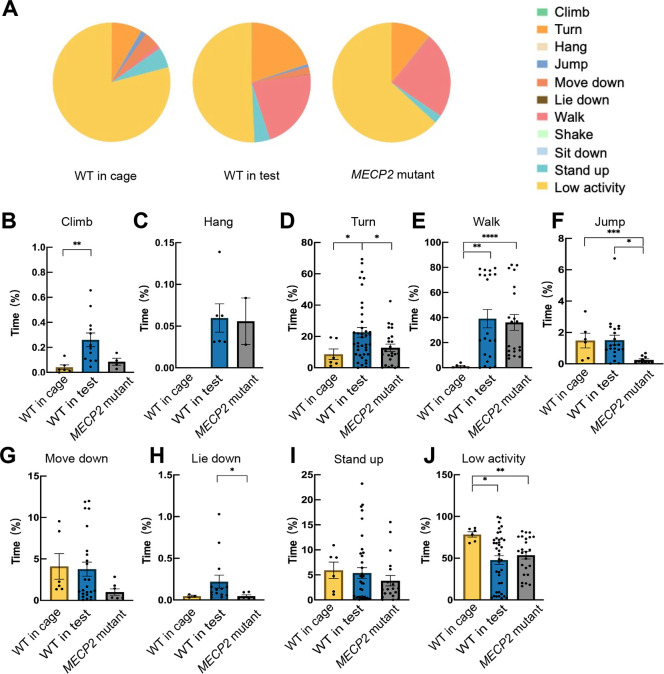
Action recognition of daily performance in WT monkeys in home cage, WT monkeys in test cage, and MECP2 mutant monkeys in test cage
A: Percentage of time spent in detected action categories. B–J: Time spent in B: Climb, C: Hang, D: Turn, E: Walk, F: Jump, G: Move Down, H: Lie Down, I: Stand Up, and J: Low Activity. Each dot represents a video clip more than 3 h in length in one day. *: P<0.05; **: P<0.01; ***: P<0.001; ****: P<0.0001.

