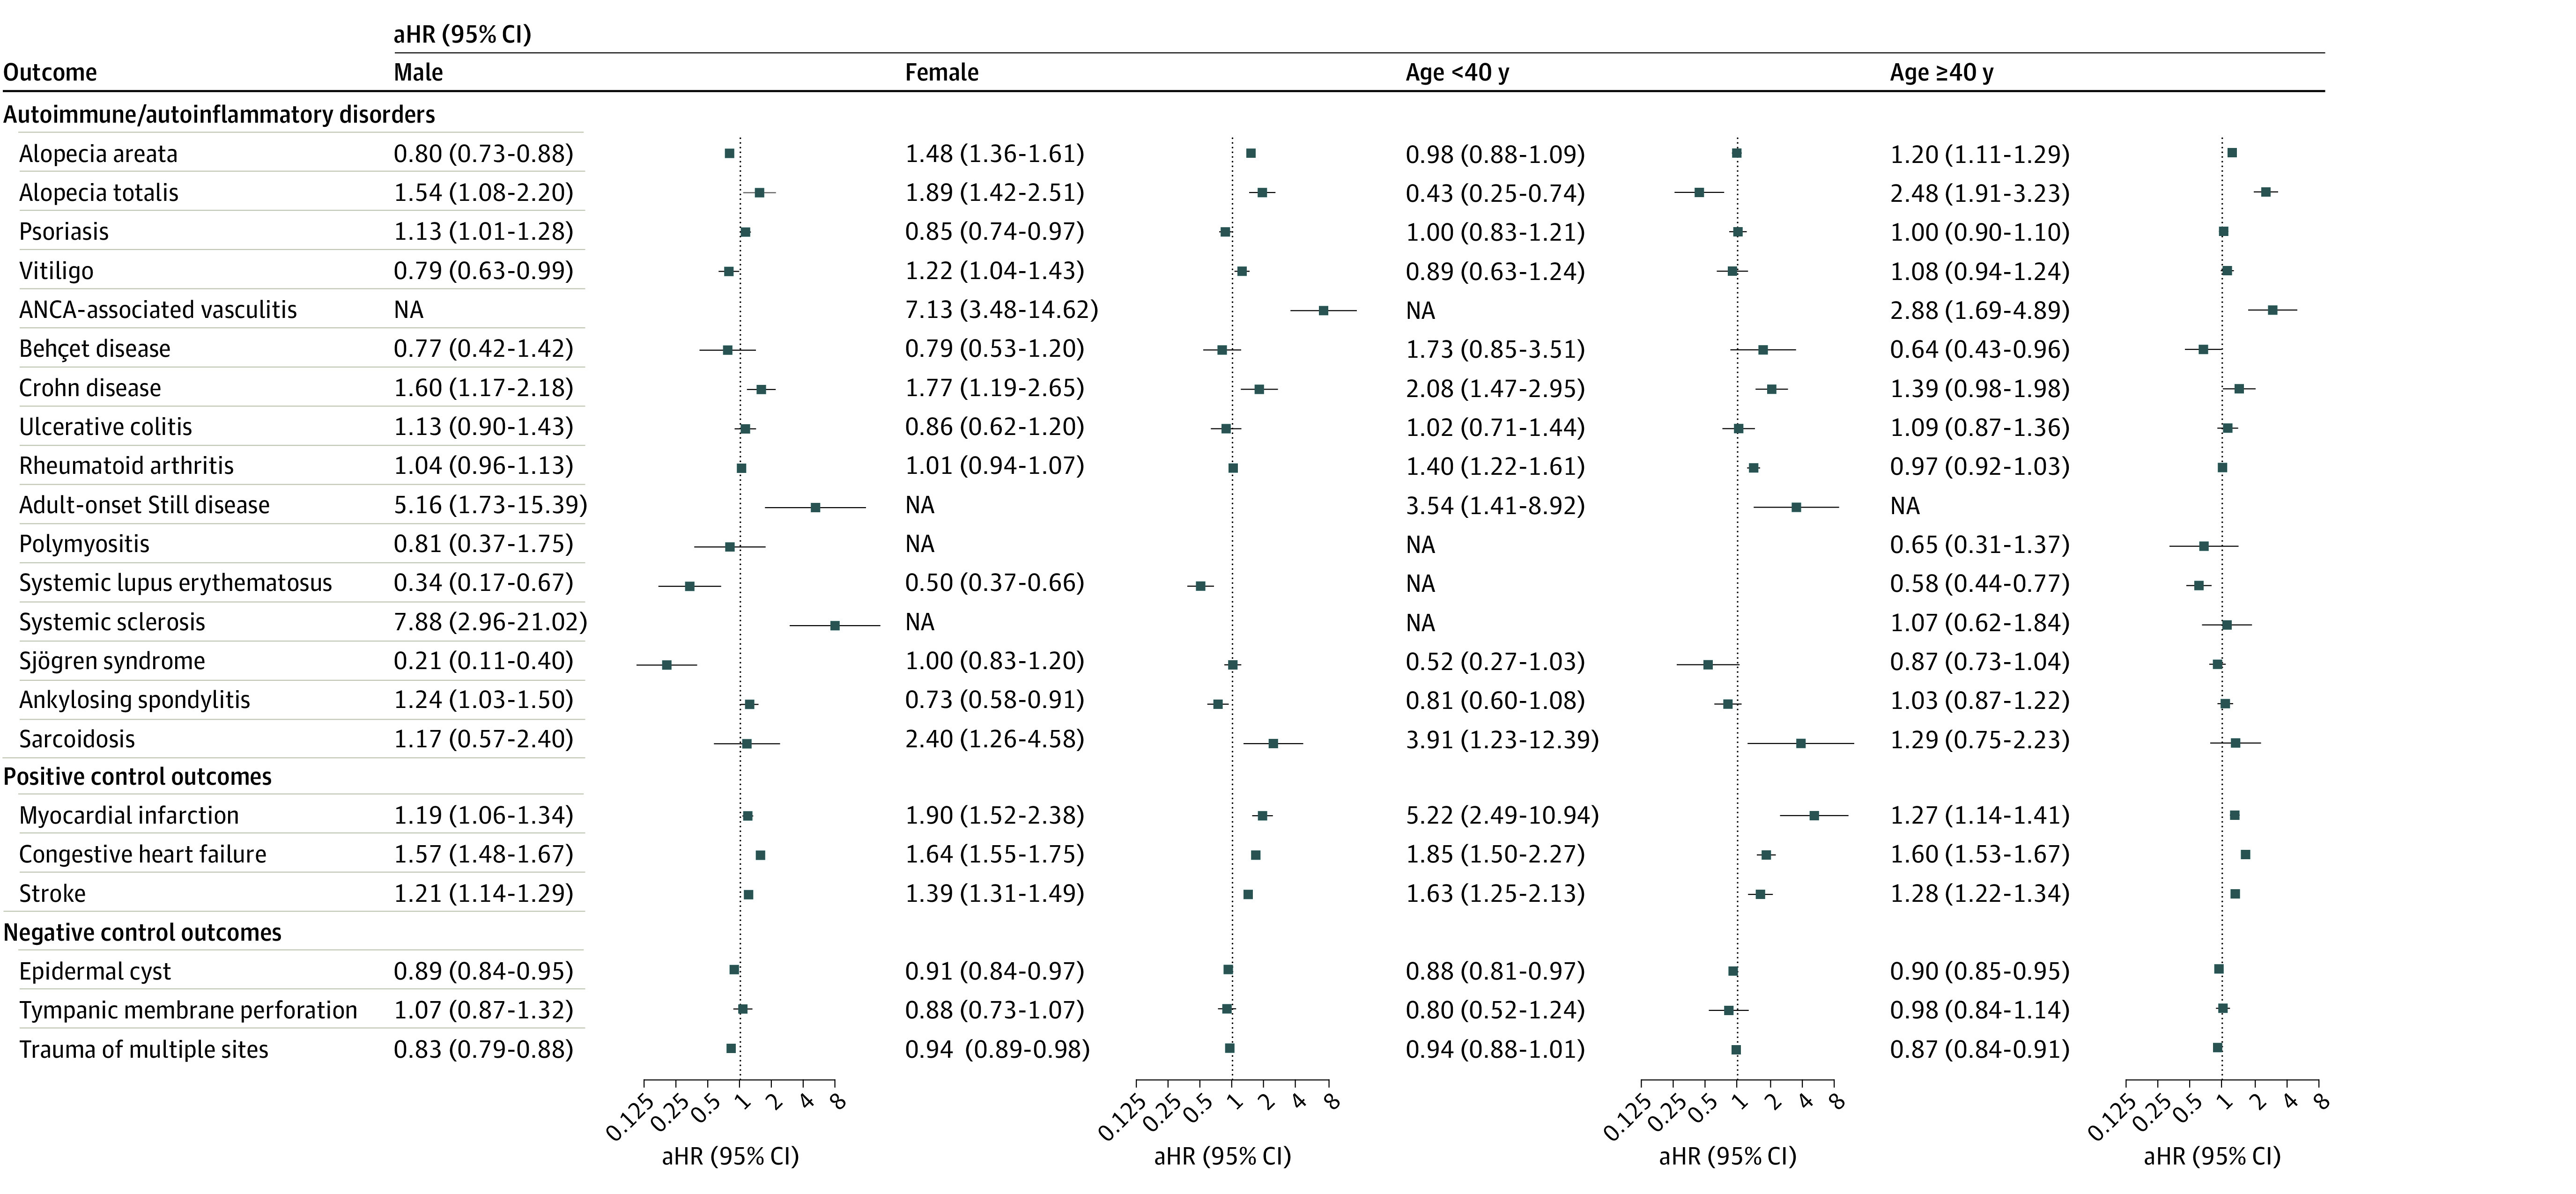
Figure 3. Subgroup Analyses of the Risks of Incident Autoimmune and Autoinflammatory Disease Outcomes Stratified by Age and Sex .

The forest plot depicts adjusted hazard ratios (aHRs) and 95% CIs of individuals with COVID-19 compared with control participants. The hazard estimates were adjusted for all 32 covariates used for the inverse probability of treatment weighting. ANCA indicates antineutrophilic cytoplasmic antibody; and NA, not available.
