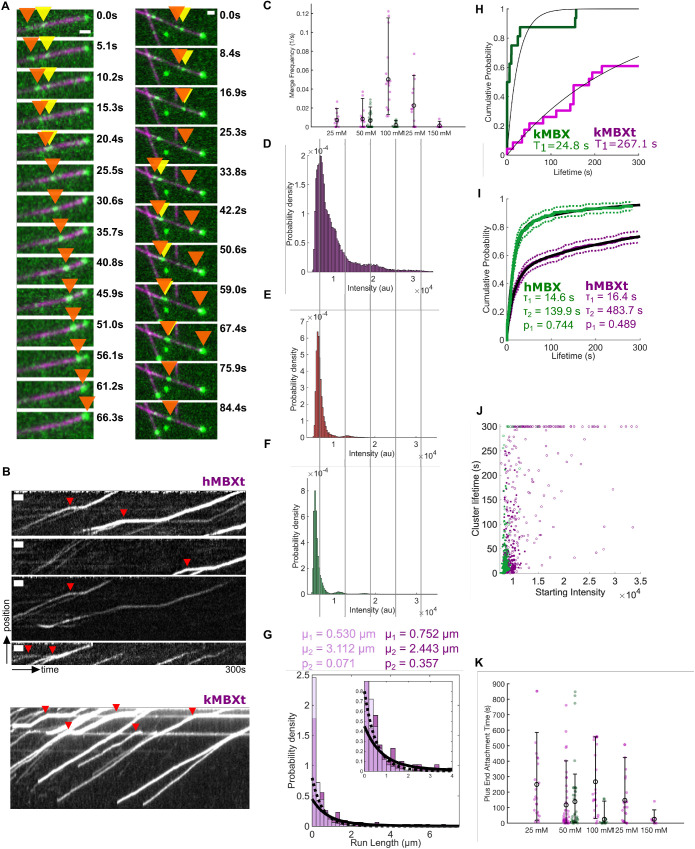
FIGURE 4:
Kinesin-5 minitetramers with the tail domain, but not those without the tail, form multimotor clusters while undergoing motility along an MT. A) hMBXt minitetramers form clusters while moving along the MT. Two example montages are shown. A subset of hMBXt motors is paused (yellow arrow), while others are processively moving (orange arrow). These two types of motors merge and then continue moving together as clusters (orange arrow). Six (left) or 10 (right) frames between timepoints. Scale bars 1 μm wide. B) Kymographs showing the assembly of hMBXt and KMBXt motor clusters. Note that many of these clusters form while one set of motors involved is paused (red triangles). Scale bars 10 s wide and 1 μm tall. C) The cumulative frequencies and their average for kMBX (green) and kMBXt (pink) motors to merge into clusters in relationship to solution-salt concentration (mM). The extended data for kMBX and kMBXt motor clustering are shown in Supplemental Figure S4., D–F) Intensity distribution for constructs D) with the tail domain (hMBXt) in the presence of ATP, E) with the tail domain (hMBXt) in the presence of AMP-PNP, and F) without the tail domain (hMBX) in the presence of ATP, suggesting that the minitetramers require the tail domain and motility to form clusters. Clusters likely correspond to two to three motors, and the blurring of the intensity distribution for motors in the presence of ATP is likely due to the quenching and unquenching of the TMR sensors used as labels during motor stepping. Lines are ∼6500 au apart. For D, n = 1406 trajectories from nine independent experiments. For E, n = 1298 trajectories from two independent experiments. For F, n = 2056 trajectories from three independent experiments. G) Total run-length distributions for single hMBXt motors (light purple; dotted line) and clusters (dark purple; solid line). Distributions were fit with a double-exponential distribution, and both groups have a short (μ1) and long (μ2) run length population. However, the fraction of motors in the long-run length population (p2) is larger for clusters. H, I) hMBXt and hMBXt Motors often reach the plus-ends of stabilized MTs and remain bound there for some time. Lifetimes were fit to a Weibull distribution. The hMBXt motors were best fit by a double Weibull distribution, suggesting the presence of populations with a short and long lifetime. The short lifetime (τ1) was similar for both hMBX and hMBXt, whereas the long lifetime (τ2) was longer for hMBXt than hMBX motors. J) Distribution of lifetimes of motors/clusters at the ends of MTs as a function of their starting intensity (average intensity of the first five frames they are detected). hMBX motors (green) generally arrive as single motors, whereas hMBXt motors (purple) often arrive as motor clusters. Open circles denote censored lifetimes (present in the first or last frame of the movie, indicating they are at least as long or longer than the point plotted). K) The cumulative MT plus-end association times for kMBX and kMBXt motors and their average values in relationship to the salt concentration (mM). The extended data for kMBX and kMBXt motor clustering are shown in Supplemental Figure S4, F and G).

