FIGURE 5:
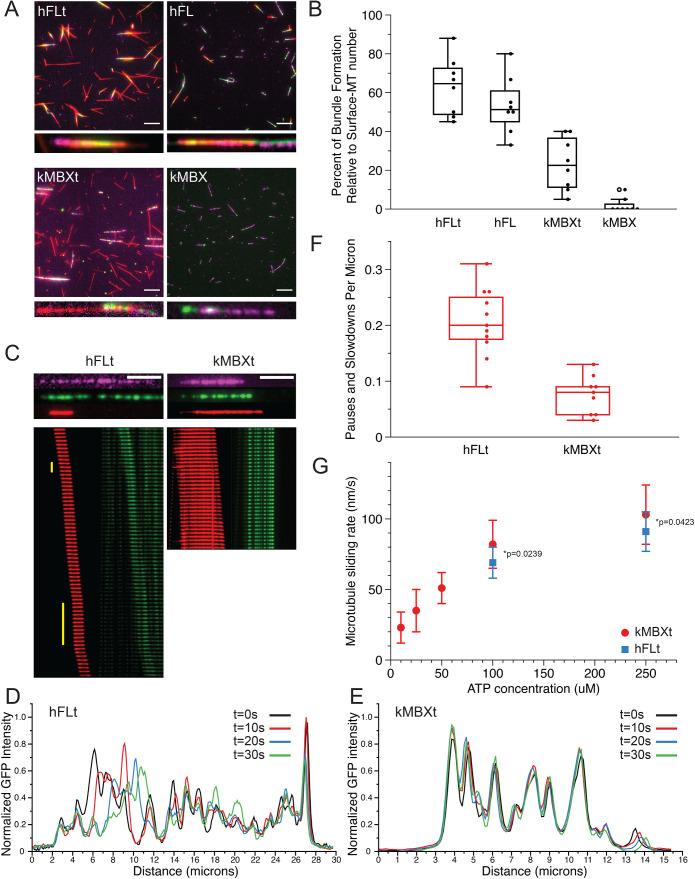
Kinesin-5 minitetramers show defects in crosslinking MTs but enhanced MT sliding once aligned, compared with native kinesin-5. A) Representative TIRF images of surface-immobilized MTs (magenta) crosslinked via kinesin-5 (green) constructs to free MTs (red). Four different kinesin-5 constructs were examined: hFLt, hFL, kMBXt, and kMBX. Scale bar = 10 microns. B) Percentage of surface-immobilized MTs that engaged in kinesin-5 mediated crosslinking with free MTs for each kinesin-5 construct. N = 8 fields of view analyzed per condition. C) Sample MT pairs (top) and kymographs (bottom) depicting MT sliding driven by either hFLt (left) or kMBXt (right). Free MT (red) and kinesin-5-GFP or nNG (green) are shown. Pauses are identified by the vertical yellow bar. Scale bar = 4 microns; frame rate for hFLT = 10 s per frame; for kMBXt = 5 s per frame. D) Linescan analysis of the GFP signal from hFLt data shown in C). Normalized GFP intensity is plotted against distance along the microtubule for four different timepoints. E) Linescan analysis of the GFP signal from kMBXt data shown in C). Normalized GFP intensity is plotted against distance along the microtubule for four different timepoints. F) Number of pauses or velocity reduction events observed per micron for hFLt and kMBXt driven MT sliding. N = 11 events for hFLt, N = 9 events for kMBXt. G) Average MT-sliding rate calculated for bundles at different ATP concentrations. N = 6 events for each condition. Error bars are SD, values are reported in Table 4.

