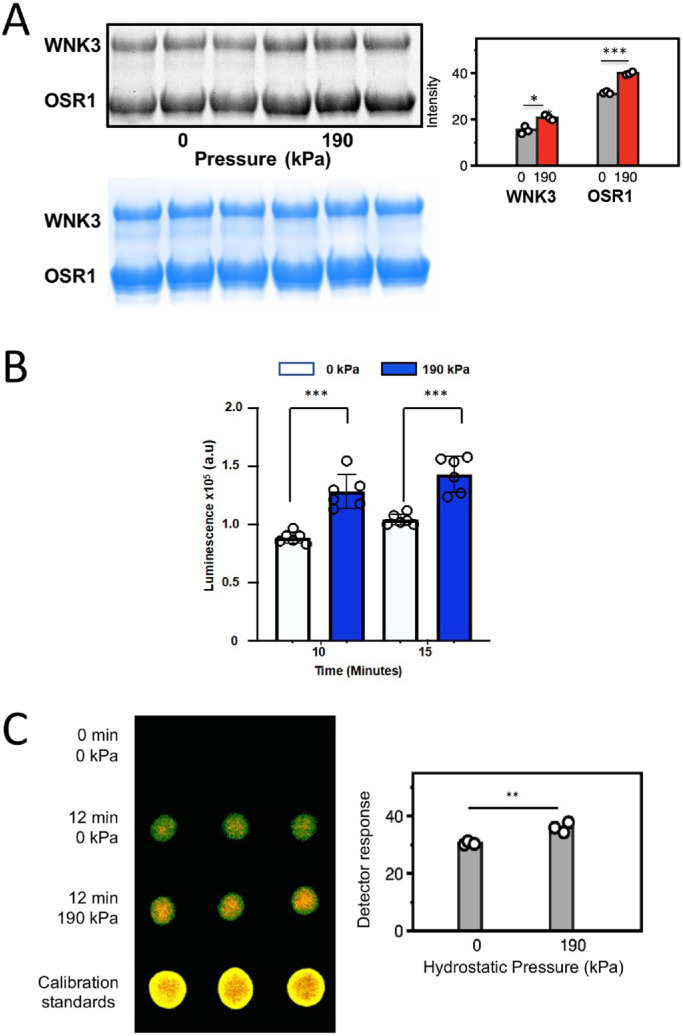
FIGURE 2:

Pressure effects on WNK3 autophosphorylation and activity in vitro. (A) using pWNK and gOSR. in the absence or presence of added hydrostatic pressure. Pro-Q® stain (back) of phospho-proteins pWNK3 and phopho-gOSR. Triplicated 15-min reactions –/+ 190 kPa using 4 mM uWNK3 and 40 mM gOSR1 in 150 mM Cl–, run at 25°C. The blue bands are Coomassie staining as loading controls. In the bar graph, gray corresponds to unpressurized pWNK3 and phospho-gOSR; red, under pressure. Two-sided t test was conducted for each protein giving * p < 0.01, *** p < 0.0001. (B) ADP-Glo ® measuring ATP consumption using uWNK3 (4 mM) and gOSR1 (40 mM). Reactions were run at 30°C. Appearance of ADP without (white) and with (blue) 190 kPa measured at 10 min and 15 min (background from reagents subtracted). (C) g32P ATP spot blots imaged by false color autoradiography of autophosphorylation of 40 mM uWNK3 at 0 and 190 kPa hydrostatic pressure induced with N2 gas. p = 0.007.
