FIGURE 5:
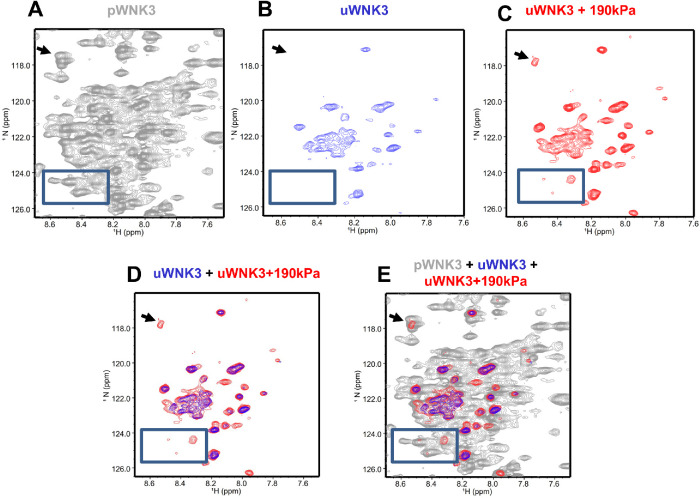
uWNK3 and pWNK3 1H,15N TROSY-HSQC. (A) pWNK3 at 50 mM chloride and 37°C. (B) uWNK3 as in (A). (C) uWNK3 with 190 kPa applied with N2. (D) Overlay of (B) and (C). (E) Overlay of (A), (B), and (C). Comparable contour levels were used for uWNK3 and uWNK3+190 kPa applied pressure. pWNK3 spectra was plotted at higher contour levels for clarity. Arrow and box indicate peaks in the uWNK3 spectrum appearing under pressure in panel (C).

