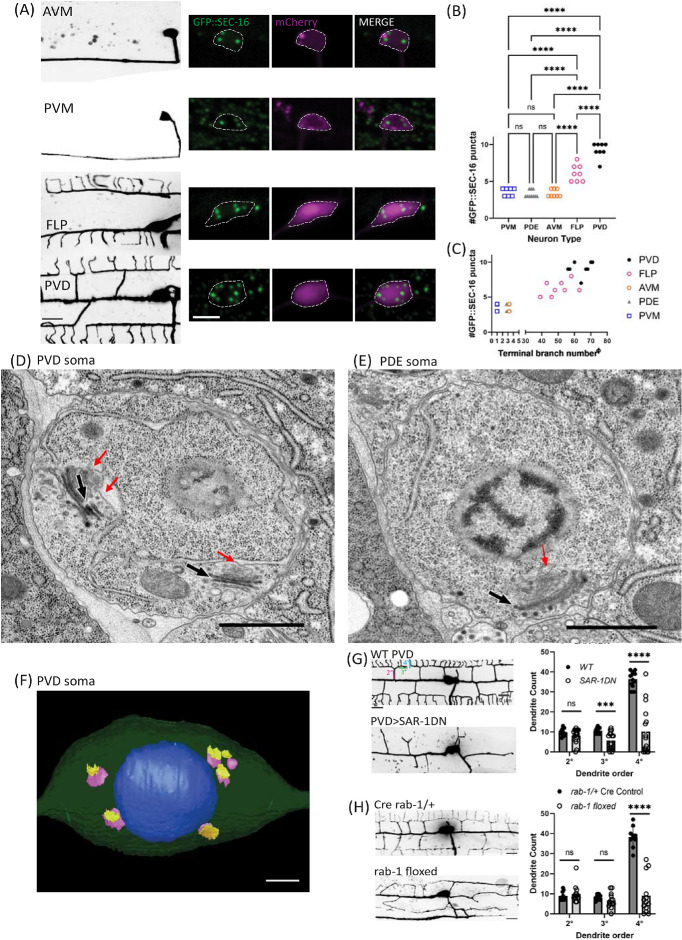
FIGURE 1:
Larger neurons have more ERESs in their somas. (A) Confocal-fluorescence microscopic images of neuron morphology on the left (scale bar = 10 µm), with closeups of soma and an endogenous ERES marker, GFP::SEC-16, on the right (scale bar = 5 µm). Background of PVM image was removed to more clearly show PVM morphology. (B) Quantification of number of GFP::SEC-16 puncta per soma in different cell types. Significance determined by one-way ANOVA, ****p < 0.0001, n ≥ 7 animals. (C) Quantification of number of GFP::SEC-16 puncta per soma in different cell types vs. number of terminal dendrites (see Methods). X-values have been nudged slightly to increase visibility of data points for PDE (x – 0.25) and AVM (x + 0.25). Pearson correlation between ERES number and terminal-dendrite number: r = 0.9282, R2 = 0.8615, p < 0.0001, n = 41 neurons with at least seven of each type. EM images of PVD (D), and PDE (E) soma. Red arrows indicate ERES. Black & white arrows indicate Golgi stacks. Scale bars = 1 µm. (F) 3D model of PVD soma constructed from EM images showing nucleus in blue, with cis (purple), and trans (yellow) cisternae of Golgi. Scale bar = 1 µm. (G) Confocal-fluorescence microscopic images of WT PVD and PVD with exogenously expressed SAR-1 dominant negative (SAR-1DN), with quantifications of secondary (2°), tertiary (3°), and quaternary (4°) dendrites in WT (n = 12 animals) and SAR-1-DN (n = 16 animals). Significance determined by multiple t tests, ***p < 0.001, ****p < 0.0001. (H) Confocal-fluorescence microscopic images of Cre rab-1/+ heterozygous control PVD (n = 10) and rab-1 floxed PVD (n = 13), with corresponding dendrite quantifications as in (I). Results were additionally repeated in at least two independent experiments.

